东盟十国简介――Vietnan
- 格式:doc
- 大小:19.50 KB
- 文档页数:1


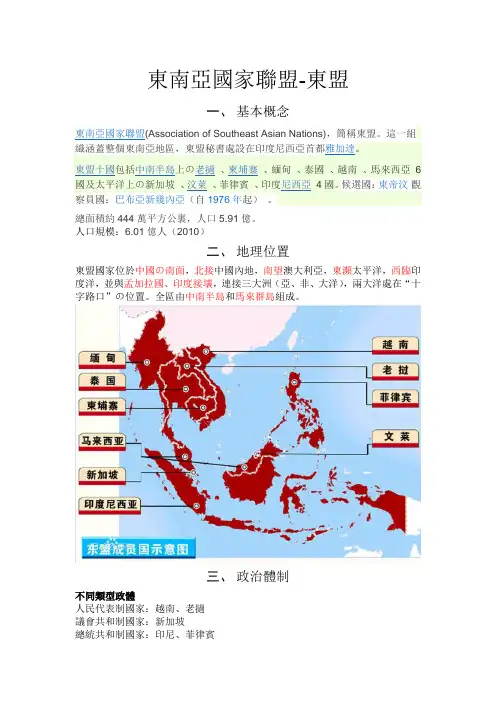
東南亞國家聯盟-東盟一、基本概念總面積約444萬平方公裏,人口5.91億。
人口規模:6.01億人(2010)二、地理位置東盟國家位於中國の南面,北接中國內地,南望澳大利亞,東瀕太平洋,西臨印度洋,並與孟加拉國、印度接壤,連接三大洲(亞、非、大洋),兩大洋處在“十字路口”の位置。
全區由中南半島和馬來群島組成。
三、政治體制不同類型政體人民代表制國家:越南、老撾議會共和制國家:新加坡總統共和制國家:印尼、菲律賓君主制國家:泰國、柬埔寨、馬來西亞和文萊軍政府國家:緬甸四、經濟發展★發展層次1.按地理位置看—“南富北窮”2.經濟發展水平――四種層次第一層次:發達國家新加坡和石油富國文萊第二層次:新興工業化國家馬來西亞、泰國、菲律賓、印尼第三層次:發展中の越南第四層次:發展程度較低の柬埔寨、老撾、緬甸東盟十國國家詳情新加坡(The Republic of Singapore)由50多個海島組成,首都新加坡城。
人口321.75萬(1999年6月統計數字)。
其中華人(占77.7%)、馬來人(占14.1%)、印度人(占7.1%)。
華人、斯裏蘭卡人多信奉佛教和道教。
馬來人和巴基斯坦人多信奉伊斯蘭教。
印度人信奉印度教和錫克教。
此外還有人信奉基督教。
英語、華語、馬來語、泰越南(The Socialist Republic of VietNam)人口7870萬(2001年7月統計數字),有54個民族,越族(京族)占89%以上,岱依、芒、依、傣、赫蒙(苗)、瑤、占、高棉等少數民族占11% ,官方語言為越南語,有華人100多萬。
主要信奉佛教,此外還信奉天主客人到家中做客,主人常用本民族最喜愛喝の酒和愛吃の生冷酸辣等食物待客,即使不和胃口,也要盡量吃,否則會被認為看不起主人。
菲律賓(The Republic of the Philippines)由7101個大小島嶼組成,總面積29.97萬平方公裏,其中呂宋島、棉蘭老島、薩馬島等11個主要島嶼約占全國總面積の96%。



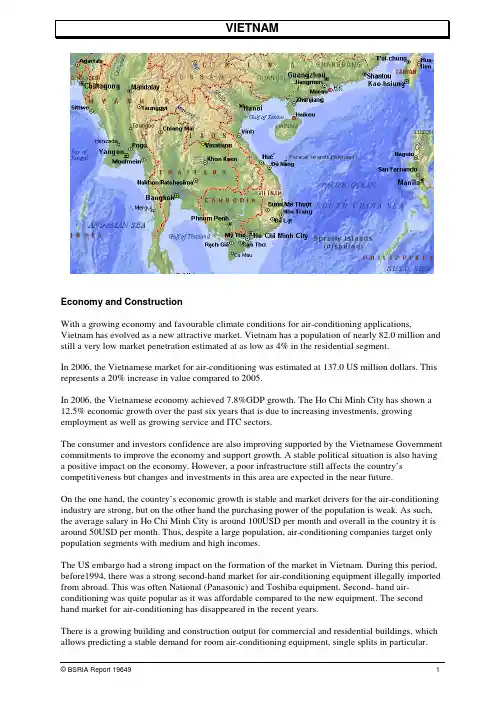
VIETNAMEconomy and ConstructionWith a growing economy and favourable climate conditions for air-conditioning applications, Vietnam has evolved as a new attractive market. Vietnam has a population of nearly 82.0 million and still a very low market penetration estimated at as low as 4% in the residential segment.In 2006, the Vietnamese market for air-conditioning was estimated at 137.0 US million dollars. This represents a 20% increase in value compared to 2005.In 2006, the Vietnamese economy achieved 7.8%GDP growth. The Ho Chi Minh City has shown a 12.5% economic growth over the past six years that is due to increasing investments, growing employment as well as growing service and ITC sectors.The consumer and investors confidence are also improving supported by the Vietnamese Government commitments to improve the economy and support growth. A stable political situation is also having a positive impact on the economy. However, a poor infrastructure still affects the country’s competitiveness but changes and investments in this area are expected in the near future.On the one hand, the country’s economic growth is stable and market drivers for the air-conditioning industry are strong, but on the other hand the purchasing power of the population is weak. As such, the average salary in Ho Chi Minh City is around 100USD per month and overall in the country it is around 50USD per month. Thus, despite a large population, air-conditioning companies target only population segments with medium and high incomes.The US embargo had a strong impact on the formation of the market in Vietnam. During this period, before1994, there was a strong second-hand market for air-conditioning equipment illegally imported from abroad. This was often National (Panasonic) and Toshiba equipment. Second- hand air-conditioning was quite popular as it was affordable compared to the new equipment. The second hand market for air-conditioning has disappeared in the recent years.There is a growing building and construction output for commercial and residential buildings, which allows predicting a stable demand for room air-conditioning equipment, single splits in particular.The residential market for air-conditioning is represented by single splits that account for more than 90% market share. The share of advanced products such as inverters and multisplits is still low.The share of windows is about 4% and will continue to decrease. Future sales are expected to target the replacement market and not first –time buyers. In 2006, the windows market reached 7,350 units and 1.9US$ million.In 2006, the chiller market in Vietnam reached 347 units and is estimated at 19.1US$ million. The scroll chillers segment for comfort cooling is very small, as VRF has emerged as a strong competitor for commercial projects.In 2006, the airside market is estimated at 5.4US$ million that includes 1.7US$ million of air-handling units and 3.8US$ million of fan coils.Panasonic, formerly known to customer as National, has established itself as the strongest brand on the market. Having a strong portfolio of home appliances, including TV and air-conditioning, Panasonic has become the market leader and has very strong customer loyalty. Thus, despite it relative high prices Panasonic managed to sustain a first place in the minisplits segment in terms of value. LG is holding first place in terms of volume and is a strong competitor to Panasonic. Japanese brands have stronger chances to succeed on the market as Vietnamese customers value the Japanese quality the most, despite the high price. It is noticeable that some local brands market their products under Japanese-like names such as Nagakawa, Funiki and Mitsu Star.Korean products are also popular due to competitive prices and are perceived as good quality products. LG is particularly strong in the north of the country and holds a second place in overall sales in Vietnam.Chinese brands have just recently entered the market. Midea is also planning to establish local production from 2007.Currently, the level of locally produced air-conditioning products is low. This may be changed in the future when foreign investors establish local production of compressors, fans and other spare parts. Currently most of equipment is imported as it is not economically feasible to manufacture air-conditioning products locally due to the lack of tax incentives.Current foreign investors activities may boost the central plant market value in Vietnam in the next few years. As such, Intel plans to build its largest chip assembly and test factory in Vietnam with total investments of $1 US billion dollars. A planned cooling capacity for this factory is 2,500 cooling tonnes.Table 1 Background data economy and construction, 2005-2009Indicator Units 2005 2006 2007 (e) 2008 (f) 2009 (f)Population Million 84.4 84.4 N/a N/a N/a GDP per capita US$ 655 655 N/a N/a N/a GDP real growth % 7.8 7.8 N/a N/a N/aInflation % 7.6 7.6 N/a N/a N/a Unemployment % N/a N/a N/a N/a N/a Source: BSRIA based on various sourcesTable 2 Percentage of sales to residential marketIndicator 2005% sales to residential marketWindow/wall 75%Single and multi splits 70%VRF NegUnitary products NegChillers 2%Source: BSRIA based on various sourcesTable 3 Current and future AC penetration into the residential and commercial marketIndicator 2005 2010PENETRATION into commercial (approx) 10% 15%PENETRATION into residential (approx) 4% 12%Source: BSRIA based on various sourcesTable A1 Residential/light commercial market, volume of outdoor units20052006 200720082009 2010Annual % change 2005-2010Window7,0007,350 7,2006,4005,900 5,100-6.1% Portable/Moveable neg neg neg neg neg neg n/a Minisplits/ductless splits -<5kW/RAC 164,050191,118 220,962255,493295,450 341,68915.8% Cooling only 147,645172,745 200,384232,445269,636 312,77816.2%Heat pump 16,40518,374 20,57823,04825,814 28,91112.0% >5kW/PAC 28,95034,074 40,72346,09352,173 59,05715.3% Cooling only 26,05530,745 36,89441,69047,110 53,23415.4%Heat pump 2,8953,329 3,8294,4035,063 5,82315.0% Total ductless splits193,000225,192 261,685301,586347,623 400,74615.7%Grand Total 200,000232,542 268,885307,986353,523 405,84615.2% Source: BSRIANote: 1. Minisplits include single/multi splits and VRF systemsTable A2 Residential/light commercial market, value, US$ million20052006200720082009 2010Annual % change 2005-2010Window 1.8 1.9 1.9 1.8 1.7 1.5-4.3% Portable/Moveable 0.0*0.0*0.0*0.0*0.0* 0.0*n/a Minisplits/ductless splits -<5kW/RAC 58.269.983.299.1118.1 140.719.3% Cooling only52.062.674.889.4106.8 127.619.7%Heat pump 6.27.28.49.711.3 13.015.9% >5kW/PAC 29.936.445.052.761.8 72.419.4% Cooling only26.432.240.046.854.7 64.019.4%Heat pump 3.5 4.2 5.0 5.97.1 8.419.1% Total ductless splits88.1106.2128.2151.8179.9 213.119.3%Grand Total 89.9108.2130.1153.6181.5 214.619.0% Source: BSRIANote: 1.Value figures are related to systems (indoor and outdoor units together)2. * represent low, but not necessary zero sales3. 1US$=16,436VNDTable A3 Residential/light commercial, average selling price, US$200520062007200820092010Annual % change 2005-2010Window 260265270275281287 2.0% Portable/Moveable n/a n/a n/a n/a n/a n/a n/a Minisplits/ductless splits -<5kW/RAC 355366377388400412 3.0% Cooling only352363373385396408 3.0%Heat pump380393407421436451 3.5% >5kW/PAC 1,0321,0681,1051,1441,1841,226 3.5% Cooling only1,0121,0471,0841,1221,1611,202 3.5%Heat pump1,2151,2581,3031,3491,3971,447 3.6% Source: BSRIANote: 1.Average selling price from manufacturer/importer to first point of distribution.2.Current prices 2005 and 2006. Constant prices from 2007 onwards.3. 1US$=16,436VNDFigure A1 Residential/light commercial market analysed by product type, outdoor unitsSource: BSRIAMinisplitsTable A4 Sales of single/multi/VRF split systems, 2006Value Volume Average marketprice for systems /outdoor unit(US$ million) (1)Outdoor units Indoor units US$Single split (one-to-one) 95.9 223,122 223,122 430Multisplit 1.0 1,020 2,040 980VRF 9.3 1,050 12,600 8,900Total 106.2 225,192 237,762 472Source: BSRIANote: 1. Manufacturer / importer prices to first point of distribution excluding installationTable A5 Imports-exports, residential/light commercial products, volume, 2006A B C D E F GHome market Imports(1) (2)Imports as% of homemarketB/CProduction(2)A -B + EExports(1) (2)Balance oftrade (2)E - BExports as% ofproductionE/DWindow/through the wall 7,350 7,000 95% 350 0 -7,000 0% Mobile (portable) neg neg n/a 0 0 n/a n/a Single splits (ductlesssplits)223,122 156,122 70% 67,000 0 -156,122 0% Conventional multisplits 1,020 1,020 100% 0 0 -1,020 0% VRF 1,050 1,050 100% 0 0 -1,050 0% Total 232,542 165,192 71% 67,350 0 -165,192 0% Source: BSRIANote: 1. Excludes all re-exporting / trading activities2. Figures should be regarded as more approximate than others in this tableSupply structureTable A6 Brand market leaders and local producers for window, mobile and minisplit products, by volume, 2006Room units MinisplitsWindow / wall Portable /moveableSmaller splits(<5kW or RAC)Larger splits –non-VRF(>5kW or PAC)VRFBrand market leaders (descending order)PanasonicToshiba CarrierSharpneg LGPanasonicToshiba CarrierMHIMitsubishi ElectricSanyoHitachiSamsungSharpFunikiYorkTCLReetechNagakawaLGPanasonicToshiba CarrierMHIMitsubishi ElectricSanyoHitachiSamsungFunikiNagakawaGeneralFujitsuDaikinCarrier ToshibaMHILGMitsubishi ElectricTheir share 80% N/a >95% >95% >95%Local producers (descending order)none none LGCarrierLGCarriernoneSource: BSRIAWindowsWindows are not very popular in Vietnam. It is interesting to note that despite the fact that consumers are very price sensitive, the share of windows, traditionally perceived as the cheapest product, is very small in Vietnam. This is due to the fact that the Vietnamese air-conditioning market has emerged much later than other Asian markets and by the time the market started growing minisplits already became a preferred product. Hence, first time customers are choosing minisplits that have better characteristics than windows and a better price.It is expected that the majority of windows sold in Vietnam from 2006 onwards will be for the replacement market. This is also supported by the fact that some units were installed through-the-wall and if a unit needs to be replaced, another through-the-wall unit is chosen. A substantial part of windows also goes for production facilities.MinisplitsSingle splitsThe single splits segment is the largest segment in the room and packaged air-conditioning segment. 9,000BTU and 11,000BTU models are the best selling capacities.In 2006, the single splits segment is estimated at 223,122 systems and 95.9US$ million.The commercial segments including cassettes, floor standing type and ceiling concealed type account for less than 5% of the minisplit market volume. A floor standing type is the most popular commercial application and has shown the fastest growth during 2004-2006.Heat pumps are quite popular in the Hanoi region. This is due to the fact that the Northern region has four weather seasons including winter whereas the Southern regions have only two seasons – dry season and monsoon. Heat pumps comprise approximately 10% of the total market volume. The price difference between heat pumps and cooling only splits is about 15-20%.MultisplitsThe Vietnamese market for multisplits is relatively small. LG is a leader in the multi split segment. In 2006, the multisplit segment is estimated at 1,020 units. Toshiba Carrier and Daikin also sell a small number of multisplits.It is expected that the multisplits market will remain relatively small. The growth in this segment will depend on the purchasing power of middle and high- income segments of population.The majority of multisplits sold in Vietnam are commercial application although some systems are sold to up-market residences. The majority of multisplits sold in Vietnam are two indoor units type. VRFDaikin is a leader in the VRF market in Vietnam. The market is estimated at 1,050 systems and valued at 9.2 US$ million. Systems can consist of several outdoor units and market volume in this report is calculated on the basis of complete system installations.Toshiba Carrier is the second strongest company in this segment.It is worth noting that currently there is a strong preference for VRF instead of scroll chillers. This is due to the fact that VRF units are perceived as more flexible. It is possible to serve only part of a new building (if for example not all tenants have moved in to the building). Strong promotion from companies such as Daikin also plays an important role and often VRF systems are considered for large cooling capacity projects.At least a 40% annual increase in the VRF market volume is expected during 2007-2009 (this is also supported by the historical trend and the growth of the segment during 2004-2006).Although sizes of projects vary, a typical VRF system consists of 12-14 indoor units and two outdoor units combined in one module to achieve a required cooling capacity. Mini-VRF systems are not popular in Vietnam as these are considered to be expensive.Only LG is manufacturing all of its RAC units in Vietnam. Carrier also produces some in Vietnam but in insignificant quantities. Local companies such as Reetech and Nagakawa source spare parts from China and assemble units in Vietnam. Midea is about to start manufacturing split units in Vietnam in 2007.Residential air-conditioning products are sold through three main routes – air-conditioning specialists, the “directly to the end-user” channel and through wholesalers. The wholesalers (big electronic appliances shops) channel is very important.Table B1 Unitary market volume of outdoor units2005 2006 2007 2008 2009 2010Annual % change 2005-2010Roof top0* 0* 0* 0* 0* 0* 0.0% Indoor packaged 95 105 115 126 139 153 10.0% Ducted splits (US type) -<17.58kW 60 67 75 84 94 106 12.0%>17.58kW 1,095 1,259 1,448 1,665 1,915 2,202 15.0%Cooling only 924 1,061 1,219 1,400 1,608 1,847 14.9%Heat pump 231 265 305 350 402 462 14.9% Total 1,155 1,326 1,523 1,750 2,010 2,308 14.9%Grand Total 1,250 1,431 1,638 1,876 2,149 2,461 14.5% Source: BSRIANote: 1. *represent low, but not necessary zero salesTable B2 Unitary market value, US$ million2005 20062007200820092010Annual % change 2005-2010Roof top 0.0 0.0 0.0 0.0 0.0 0.0 n/a Indoor packaged 1.0 1.2 1.3 1.5 1.7 1.9 12.8% Ducted splits (US type) -<17.58kW0.1 0.1 0.1 0.1 0.1 0.2 15.9%>17.58kW 2.5 3.0 3.5 4.2 5.0 5.9 18.7%Cooling only 2.1 2.5 2.9 3.5 4.1 4.9 18.9%Heat pump0.5 0.6 0.7 0.8 1.0 1.2 18.9% Total 2.6 3.1 3.6 4.3 5.1 6.1 18.9%Grand Total 3.6 4.2 4.9 5.8 6.8 8.0 17.2% Source: BSRIANote: 1. Includes indoor and outdoor units2. * represent low, but not necessary zero sales3. 1US$=16,436VNDTable B3 Unitary, average selling price, US$2005 2006 2007 2008 2009 2010Annual % change 2005-2010Roof topN/a N/a N/a N/a N/a N/a N/a Indoor packaged 10,800 10,800 11,070 11,347 11,630 11,921 12,219 Ducted splits (US type) -<17.58kW 1,200 1,242 1,270 1,330 1,377 1,425 3.5%>17.58kW 2,300 2,381 2,450 2,500 2,630 2,700 3.3%Cooling only 2,250 2,360 2,410 2,495 2,540 2,672 3.5%Heat pump 2,100 2,174 2,250 2,328 2,410 2,494 3.5% Source: BSRIANote: 1.Average selling price from manufacturer/importer to first point of distribution.2.Current prices 2005 and 2006. Constant prices from 2007 onwards.3. 1US$=16,436VNDFigure B1 Unitary market analysed by volume, outdoor unitsSource: BSRIATable B4 Imports-exports, unitary products, volume, 2006A B C D E F GHome market Imports(1) (2)Imports as% of homemarketB/CProduction(2)A -B + EExports(1) (2)Balance oftrade (2)E - BExports as% ofproductionE/DRooftops neg neg n/a n/a 0 n/a n/a US-style ducted splits 1,326 1,326 100% 0 0 -1,326 0% Other large packaged 105 65 62% 40 0 -65 0% Total 1,431 1,391 97% 40 0 -1,391 0% Source: BSRIANote: 1. Excludes all re-exporting / trading activities2. Figures should be regarded as more approximate than others in this tableTable B5 Brand market leaders and local producers for unitary products, by volume, 2006Rooftop US-style ducted Other large packagedMarket leaders (descending order)neg TraneCarrierJCI (York)DaikinDaikinCarrierTraneJCI (York)ReetechTheir share N/a >90% >90%Local producers (descending order)none ReetechMcQuayOthersnegSource: BSRIAIn 2006, the US-style ducted splits segment was estimated at 1,326 units and valued at 3.1US$ million dollars. 10 cooling tonne is the most sold capacity, this segment accounts for more than half of the total market volume. Trane mostly sells US-ducted splits in the >17.58 kW (>5 cooling tonnes) capacity range and is a market leader in this segment.The rooftops market in Vietnam is negligible. Firstly, these units are perceived as very expensive. Secondly, this application is limited in Vietnam due to monsoons and to the roof construction that is typically not flat. The few rooftops sold were in the 30-40 cooling tonne capacity range but the market is too small to be presented.The indoor packaged market is represented by large water-cooled units sold by Trane, Carrier and Daikin. However in this category, Daikin and Carrier are more competitive on price and, hence, stronger. In 2006, the indoor packaged market is estimated at 105 units and valued at 1.2US$ million. Factories are the main application for indoor packaged products. Very few units are going for office applications.Recently, Reetech has increased their market share in the unitary segment due to competitive pricing.Table C1 Chiller market, volume of units2005 2006 2007 2008 2009 2010Annual % change 2005-2010ChillersReciprocating, screw, scroll 275 325 361 400 444 493 12.4% Centrifugal 25 22 35 28 31 34 6.3% Absorption>350kW neg neg neg neg neg neg n/a Air cooled 153 170 189 209 232 258 11.0% Water cooled 147 177 207 219 243 270 12.9% <100kW 75 85 96 108 122 138 13.0%>100kW 225 262 300 320 353 389 11.6% Total Chillers 300 347 396 428 475 527 11.9% Source: BSRIANote: 1. * implies very low but not necessarily zero salesTable C2 Chiller market value, US$ million2005 2006 2007 2008 2009 2010Annual % change 2005-2010ChillersReciprocating, screw, scroll 13.1 16.8 19.0 21.5 24.2 27.4 15.9% Centrifugal 2.5 2.3 3.6 2.9 3.2 3.6 7.0% Absorption>350kW 0.0 0.0 0.0 0.0 0.0 0.0 n/a Air cooled 6.1 7.0 8.4 9.0 10.2 11.4 13.4% Water cooled 9.5 12.0 14.2 15.3 17.3 19.5 15.4% <100kW 0.4 0.5 0.6 0.7 0.8 0.9 17.2%>100kW 15.2 18.5 22.0 23.7 26.7 30.1 14.6% Total Chillers 15.6 19.1 22.6 24.3 27.5 30.9 14.6% Source: BSRIANote: 1. * implies very low but not necessarily zero sales2. 1US$=16,436VNDTable C3 Chiller, average selling price, US$2005 2006 2007 2008 2009 2010Annual % change 2005-2010ChillersR eciprocating, screw, scroll 47,636 51,692 52,624 53,572 54,537 55,520 3.1% Centrifugal 101,200 102,273 102,857 103,036 103,871 104,412 0.6% Absorption>350kW n/a n/a n/a n/a n/a n/a n/a Air cooled 39,841 41,503 44,327 43,034 43,745 44,406 2.2% Water cooled 64,859 67,740 68,655 69,951 71,131 72,316 2.2% <100kW 5,333 6,100 6,230 6,310 6,380 6,400 3.7%>100kW 67,689 70,669 73,296 73,869 75,540 77,231 2.7% Source: BSRIANote: 1. Average selling price from manufacturer/importer to first point of distribution.2.Current prices 2005 and 2006. Constant prices from 2007 onwards.3. 1US$=16,436VNDFigure C1 Chillers analysed by type of cooling, by value, US$ millionSource: BSRIATable C4 Imports-exports, chiller products, value (US$), 2006A B C D E F GHome market Imports(1) (2)Imports as% of homemarketB/CProduction(2)A -B + EExports(1) (2)Balance oftrade (2)E - BExports as% ofproductionE/DChillers 19.1 19.1 100% 0.0 0.0 -19.1 0% Source: BSRIANote: 1. Excludes all re-exporting / trading activities2. Figures should be regarded as more approximate than others in this tableTable C5 Brand market leaders and local producers for chiller products, by value, 2006All chillers <350kW >350kWMarket leaders (descending order)TraneCarrierJCI (York)HitachiFushenKhon LinhHstarsDailinTeccoTraneCarrierJCI (York)HitachiFushenKhon LinhHstarsDailinTeccoTraneCarrierJCI (York)HitachiFushenKhon LinhHstarsDailinTeccoTheir share 90% >90% >90%Local manufacturers(descending order)None significant None significant None significantSource: BSRIAIn 2006 the Vietnamese chiller market reached 347 units and is estimated at 19.1US$ million.In terms of cooling, water-cooled chillers slightly prevail in volume terms. 60% of screw chillers and 10% of scroll chillers are water-cooled. Overall, water-cooled type accounts for 51% of the total market.Small scroll chillers for comfort cooling are losing market share to VRF units. Customers prefer VRF systems as they are more flexible. In 2005, the small scroll chillers segment is estimated at approximately 250 units, and only 70 of them are for comfort cooling. The rest of the small scroll chillers are for industrial and process applications. Screw chillers are going for office and large commercial applications.The market for centrifugal chillers is relatively small. This is due to the still small number of high-rise buildings in Vietnam. Centrifugal chillers are typically sold for combined industrial/comfort cooling applications (factories) and large shopping malls. It is estimated that the market reached 22 units in 2006 and was valued at 2.3US$ million. However, the demand for centrifugal chillers is expected to grow within the next five years as foreign investments are slowly increasing and the economy is getting stronger.Intel has announced the building of a large factory near Ho Chi Minh City that will require 2,500 tonnes of cooling capacity. It is expected that this will boost the centrifugal segment in 2007. Reciprocating chillers are still present on the Vietnamese market, however, their share is slowly decreasing. Customers realised advantages of screw and scroll chillers so reciprocating chiller are expected to become a niche market. Trane does not produce reciprocating chillers, but Carrier, Hitachi and York still sell some small quantities. This market is dominated by such companies as Dalian (China). Reciprocating chillers are mostly used for process and industrial applications. In 2006 the total reciprocating segment was estimated at around 15 $US million and around 300 pieces. However only a small number of reciprocating chillers are going for comfort cooling.Overall, American companies are dominating the chillers and airside products markets. McQuay established its operations in Vietnam in 2006 although hasn’t achieved substantial sales yet.The market for absorption chillers in Vietnam is negligible. The pharmaceutical industry is one of the possible applications for absorption chillers.Currently nearly 100% of the central plant products sold in Vietnam are imported. It is expected that local production may strengthen in the future. This process can be facilitated by local production of compressors, fans and other parts, however, there is no information that such facilities are about to be open in Vietnam.The contractors route is a main distribution channel for central plant products in Vietnam. 60-70% of chillers are sold through contractors. Contractors often buy equipment and, hence, are the main specifiers of brands together with HVAC design engineers. Reetech is the largest Vietnamese HVAC contractor.The main route for central plant products is via contractors who usually buy equipment and who are usually main influencers regarding solutions and brands.Table D1 AHU and fan coil market, volume of units2005 2006 2007 2008 2009 2010Annual % change 2005-2010AHU 460 529 608 700 805 925 15.0% Fan coilConcealed 14,474 17,651 20,299 23,343 26,845 30,872 16.4%Cased 1,134 1,361 1,579 1,831 2,124 2,464 16.8%Total 15,608 19,012 21,877 25,175 28,969 33,336 16.4%Grand Total 16,068 19,541 22,486 25,874 29,774 34,261 16.4% Source: BSRIATable D2 AHU and fan coil market value, US$ million2005 2006 2007 2008 2009 2010Annual % change 2005-2010AHU 1.4 1.7 1.9 2.3 2.7 3.1 17.1% Fan coilConcealed 2.8 3.5 4.1 4.8 5.7 6.8 19.8%Cased 0.2 0.3 0.4 0.4 0.5 0.6 20.3%Total 3.0 3.8 4.5 5.3 6.3 7.4 19.9%Grand Total 4.4 5.4 6.4 7.6 8.9 10.6 19.0% Source: BSRIANote: 1. 1US$=16,436VNDTable D3 AHU and fan coil, average selling price, US$2005 2006 2007 2008 2009 2010Annual % change 2005-2010AHU 3,100 3,150 3,200 3,250 3,300 3,400 1.9% Fan coilConcealed 190 196 202 208 214 220 3.0%Cased 220 227 233 240 248 255 3.0% Source: BSRIANote: 1. Average selling price from manufacturer/importer to first point of distribution.2. Current prices 2005 and 2006. Constant prices from 2007 onwards.3. 1US$=16,436VNDFigure D1 AHU market analysed by value, US$ millionSource: BSRIAFigure D2 Fan coil market analysed by volumeSource: BSRIATable D4 Imports-exports, AHU and Fan Coil products, value (US$ million), 2006A B C D E F GHome market Imports(1) (2)Imports as% of homemarketB/CProduction(2)A -B + EExports(1) (2)Balance oftrade (2)E - BExports as% ofproductionE/DAHU 1.7 1.6 94% 0.1 0.0 -1.6 0% Fan Coil 3.8 3.7 97% 0.1 0.0 -3.7 0% Total 5.5 5.3 96% 0.2 0.0 -5.3 0%Source: BSRIANote: 1. Excludes all re-exporting / trading activities2. Figures should be regarded as more approximate than others in this tableTable D5 Brand market leaders and local producers for AHU and fan coil products, 2006AHU Fan coilsMarket leaders (descending order)TraneCarrierDaikinJCI (York)TraneCarrierJCI (York)ReetechDaikinSinkoTheir share >95% >90%Local manufacturers (descending order)ReetechOthersnegSource: BSRIACommentary• The air-handling units market is estimated at 1.7 US$ million and slightly more than 500 units. • Simple air-handling units applications are going to offices and other commercial applications;more complex units (to provide a better indoor air quality) are going for pharmaceutical and other industrial applications.• Local production for air-handling units and fan coils is limited unlike in many other regional markets. This is due to a still low investment level in production facilities. However, there are some tax incentives for local manufacturers, especially those that use local and not imported parts. At the moment, there is a deficit of good quality spare parts and components produced locally and companies that manufacture air-conditioning are importing spare parts from abroad, hence are not able to compete on price. Currently, the import tax for air-handling units from Thailand and Malaysia is 5% which makes importing very attractive.• Reetech is one of the local companies manufacturing air-handing units and other air-conditioning equipment. But the company, in fact, assembles units from parts imported from China, Thailand and Malaysia.• Main applications for fan coils are offices and hotels. In 2005, the Vietnamese fan coils market is estimated at 19,012 units and the majority of units are concealed.• It is expected that the market volume for fan coils will grow by an average 16% per year due to the growing commercial property market. The growth in the air-handling units segment will correlate with the growth in the chiller segment. The market value of the air-handling unitssegment is estimated to increase by approximately 20% in 2007.• Airside products are often sold in a “package” with chillers. Hence the market for air-side products is dominated by chiller companies: Trane, Carrier and JCI (York).。

越南是一个东南亚的国家,位于中南半岛,东临南海,西接老挝和柬埔寨,南面和西南面则与泰国相邻。
越南是一个美丽而多元的国家,拥有许多自然和文化资源,也因其独特的历史和地理位置而受到世界的关注。
越南的首都是河内,这是一个富有历史和文化的城市,是越南的政治、文化和经济中心。
河内有许多历史遗迹、美食、艺术和文化景观,如震旦古城、胡志明纪念馆、水上木屋餐厅和越南国家歌剧院等。
越南也以其壮观的自然景观而闻名。
越南的海岸线长达3200公里,拥有许多美丽的海滩和海湾,如岘港湾和下龙湾等。
此外,越南还拥有许多壮观的山脉和高原,如河静省的泰山和达威山。
越南还是一个文化多元、民族众多的国家,拥有悠久的历史和悠久的文化传统。
越南的文化融合了中国、印度、法国和美国的影响,创造了自己独特的文化风貌。
越南的传统节日,如春节和中秋节,也是一个重要的文化活动,吸引了许多游客前来观赏和体验。
越南的经济也在迅速发展。
越南的制造业、旅游业和农业等产业都呈现出强劲的增长趋势。
越南的政府也在推行一系列的经济改革,以吸引更多的外国投资和促进经济的多元化发展。
总之,越南是一个美丽而多元化的国家,拥有许多自然和文化资源。
越南的政治、文化和经济中心是河内,其海岸线和自然景观也是世界闻名。
越南还拥有悠久的历史和文化传统,其文化融合了多种文化影响。
越南的经济也在迅速发展,为未来的发展和繁荣奠定了坚实的基础。
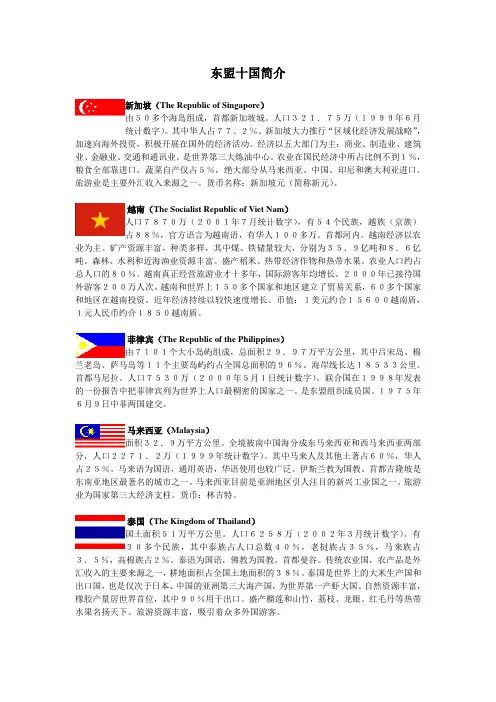
东盟十国简介新加坡(The Republic of Singapore)由50多个海岛组成,首都新加坡城。
人口321.75万(1999年6月统计数字)。
其中华人占77.2%。
新加坡大力推行“区域化经济发展战略”,加速向海外投资,积极开展在国外的经济活动。
经济以五大部门为主:商业、制造业、建筑业、金融业、交通和通讯业。
是世界第三大炼油中心。
农业在国民经济中所占比例不到1%,粮食全部靠进口,蔬菜自产仅占5%,绝大部分从马来西亚、中国、印尼和澳大利亚进口。
旅游业是主要外汇收入来源之一。
货币名称:新加坡元(简称新元)。
越南(The Socialist Republic of Viet Nam)人口7870万(2001年7月统计数字),有54个民族,越族(京族)占88%,官方语言为越南语,有华人100多万。
首都河内。
越南经济以农业为主。
矿产资源丰富,种类多样,其中煤、铁储量较大,分别为35.9亿吨和8.6亿吨。
森林、水利和近海渔业资源丰富。
盛产稻米、热带经济作物和热带水果。
农业人口约占总人口的80%。
越南真正经营旅游业才十多年,国际游客年均增长。
2000年已接待国外游客200万人次。
越南和世界上150多个国家和地区建立了贸易关系,60多个国家和地区在越南投资。
近年经济持续以较快速度增长。
币值:1美元约合15600越南盾,1元人民币约合1850越南盾。
菲律宾(The Republic of the Philippines)由7101个大小岛屿组成,总面积29.97万平方公里,其中吕宋岛、棉兰老岛、萨马岛等11个主要岛屿约占全国总面积的96%。
海岸线长达18533公里。
首都马尼拉。
人口7530万(2000年5月1日统计数字)。
联合国在1998年发表的一份报告中把菲律宾列为世界上人口最稠密的国家之一。
是东盟组织成员国。
1975年6月9日中菲两国建交。
马来西亚(Malaysia)面积32.9万平方公里。
全境被南中国海分成东马来西亚和西马来西亚两部分,人口2271.2万(1999年统计数字)。
东盟十国经济体名词解释
东盟十国经济体是指东南亚国家联盟(ASEAN)成员国的经济总体,包括印度尼西亚、马来西亚、菲律宾、新加坡、泰国、越南、文莱、柬埔寨、老挝和缅甸。
这些国家在地理位置上紧密相连,经济上也有着较为密切的联系。
东盟十国经济体的发展水平不尽相同,其中新加坡和马来西亚等较为发达的经济体已成为全球知名的金融中心和制造业基地;而泰国和印度尼西亚等国则拥有较大的人口规模和丰富的自然资源,具有较强的制造业潜力。
此外,越南等东盟新兴市场也备受关注。
为了促进东盟十国经济体的合作与发展,东盟成员国于1992年签署了《东南亚自由贸易区协议》(AFTA),旨在降低成员国之间的关税壁垒并逐步实现自由贸易区建设。
此外,东盟还与中国、日本、韩国等周边大国签署了自由贸易协定,加强了东盟十国经济体与周边国家的贸易往来。
总之,东盟十国经济体是一个多样化而又充满活力的经济总体,在全球化进程中发挥着越来越重要的作用。
一、东盟十国概述东盟十国即东南亚国家联盟,包括文莱、柬埔寨、印度尼西亚、老挝、马来西亚、缅甸、菲律宾、新加坡、泰国、越南。
总面积约446万平方公里,人口约5.6亿。
东盟秘书处设在印度尼西亚首都雅加达。
东盟十国的排序通常在华举办的我与东盟国家的外事活动时,建议将中国放在开头或结尾,然后东盟10国按国家英文首字母排序排列,如下:文莱、柬埔寨、印尼、老挝、马来西亚、缅甸、菲律宾、新加坡、泰国、越南。
1文莱Brunei2柬埔寨Cambodia3印尼Indonesia4老挝Laos5马来西亚Malaysia6缅甸Myanmar7菲律宾Philippines8新加坡Singapore9泰国Thailand10越南Vietnam东盟十国的全称及英文名文莱达鲁萨兰国Negara Brunei Darussalam柬埔寨王国The Kingdom of Cambodia印度尼西亚共和国Republic of Indonesia老挝人民民主共和国The People's Democratic Republic Laos 马来西亚Malaysia缅甸联邦Myanmar菲律宾共和国The Republic of Philippines新加坡共和国The Republic of Singapore泰王国Thailand越南社会主义共和国The Socialist Republic of Vietnam文莱【国名】文莱达鲁萨兰国(Negara Brunei Darussalam)。
【国旗】呈横长方形,长与宽之比为2:1。
由黄、白、黑、红四色组成。
黄色的旗地上横斜着黑、白宽条,中央绘有红色的国徽。
【国徽】呈红色。
一弯新月环抱着一根棕榈树干,其上为展开的双翼,双翼之上为一顶华盖和一面旗帜,这象征文莱信奉伊斯兰教苏丹至高无上。
在新月中央用马来文写着“永远在真主指导下,万事如意。
”中心图案两侧有两只手臂,表示人民向真主祈求,人民对苏丹和政府的拥护。
东盟十国的基本情况东南亚国家联盟(简称东盟)是集合东南亚区域国家的一个政府性国际组织,于1967年8月8日成立于泰国曼谷,现有10个成员国:印度尼西亚、马来西亚、菲律宾、泰国、新加坡、文莱、柬埔寨、老挝、缅甸、越南。
2019GDP为3.14万亿美元,6.55亿人1.印度尼西亚由17508个岛屿组成,是世界上最大的群岛国家,也是多火山多地震的国家,疆域横跨亚洲及大洋洲,别称“千岛之国”。
“亚洲四小虎”之一国土面积:1913578.68平方公里人口数量:2.62亿(2019年)GDP:11191.9亿美元(2019年)人均GDP:4175美元(2019年)2.泰国泰国位于中南半岛中部,其西部与北部和缅甸、安达曼海接壤,东北边是老挝,东南是柬埔寨,南边狭长的半岛与马来西亚相连。
“亚洲四小虎”之一国土面积:513,120平方公里人口数量:69,037,513(2017年)GDP:5440亿美元人均GDP:8000美元3.新加坡新加坡北隔柔佛海峡与马来西亚为邻,南隔新加坡海峡与印度尼西亚相望,毗邻马六甲海峡南口,国土除新加坡岛(占全国面积的88.5%)之外,还包括周围63个小岛。
“亚洲四小龙”之一国土面积:724.4平方公里人口数量:570万GDP:3720亿美元人均GDP:6.52万美元4.马来西亚由马来半岛南部的马来亚和位于加里曼丹岛北部的沙捞越、沙巴组成,北与泰国接壤,南与新加坡隔柔佛海峡相望,东临中国南海,西濒马六甲海峡。
“亚洲四小虎”之一国土面积:330345平方公里人口:3200万人GDP:3647亿美元人均GDP:11193美元5.菲律宾位于亚洲东南部,主要分吕宋、米沙鄢和棉兰老岛三大岛群,共有大小岛屿7000多个,“亚洲四小虎”之一。
国土面积:29.97万平方公里人口数量:1.049亿人GDP:3768亿美元(2019年)人均GDP:3458美元(2019年)6.越南位于东南亚的中南半岛东部,北与中国广西、云南接壤,西与老挝、柬埔寨交界,国土狭长,紧邻中国南海。
东盟十国概况越南概况国名:越南社会主义共和国(The Socialist Republic of Viet Nam)国庆日(独立日):9月2日(1945年)越南南方解放日:4月30日(1975年)越南共产党成立日:2月3日(1930年)胡志明诞辰日:5月19日(1890年)国旗:越南宪法规定:“越南社会主义共和国国旗为长方形,其宽度为长度的三分之二,红底中间有五角金星。
”即通常说的金星红旗。
国旗旗地为红色,旗中心为一枚五角金星。
红色象征革命和胜利,五角金星象征越南劳动党对国家的领导,五星的五个角分别代表工人、农民、士兵、知识分子和青年。
国徽:呈圆形。
红色的圆面上方镶嵌着一颗金黄色的五角星;下端有一个金黄色的齿轮,象征工业;圆面周围对称地环绕着两捆由红色饰带束扎的稻穗,象征农业;金色齿轮下方的饰带上用越文写着“越南社会主义共和国”。
国徽图案是1956年选定的。
国歌:越南的国歌是《进军歌》。
《进军歌》1945年8月革命前产生于越北解放区。
1946年召开的越南第一届国会第二次会议正式确定《进军歌》为国歌。
1955年第一届国会第五次会议根据政府建议对《进军歌》的歌词作了一些小修改。
1976年7月2日,统一的越南国会通过决议,确定《进军歌》为全国统一后的越南社会主义共和国国歌。
自然地理:32.95万平方公里。
位于中南半岛东部,北与中国接壤,西与老挝、柬埔寨交界,东面和南面临南海,海岸线长3260多公里。
越南地形狭长,南北长1600公里,东西最窄处为50公里。
越南地势西高东低,境内四分之三为山地和高原。
北部和西北部为高山和高原。
中部长山山脉纵贯南北。
主要河流有北部的红河,南部的湄公河。
红河和湄公河三角洲地区为平原。
1989年全国森林覆盖面积9.8万平方公里。
越南全国地处北回归线以南,高温多雨,属热带季风气候。
年平均气温24℃左右。
年平均降雨量为1500—2000毫米。
北方分春、夏、秋、冬四季。
南方雨旱两季分明,大部分地区5—10月为雨季,11月至次年4月为旱季。