11 Multiple regression
- 格式:pdf
- 大小:307.88 KB
- 文档页数:10


曲式分析基础教程电子版
一、什么是多变量回归分析
多变量回归分析(Multiple Regression Analysis)是用多个变量(即自变量)预测一个变量(即因变量)的统计分析方法,它可以反映多个自变量对因变量的影响程度。
多变量回归分析可以用来研究观察变量之间的依赖关系以及其中前因变量和后果变量之间的影响。
二、多变量回归分析用途
1、用于社会科学和其他研究领域
多变量回归分析用于社会科学领域的研究时,主要用于回答某一行为是否受者多个因素影响的问题。
在商业企业、投资银行、政府甚至军事方面,也采用多变量回归分析来研究决策过程。
2、用于定量分析
多变量回归分析还可以用于定量分析中。
它可以用于研究投资者如何利用多个基本因素去分析股票的表现或利润,用来预测不同的波动指标,从而做出投资或进行交易决策。
三、多变量回归分析的步骤
1、数据收集:收集描述变量和因变量的样本数据;
2、数据清洗:审查、检查和清除不可用数据,校验数据一致性;
3、变量预处理:重新编码变量并归一化、分箱变量,或者聚类变量;
4、拟合多元线性回归模型:使用最小二乘法进行回归;
5、训练模型:使得给定的模型参数可以较好的模拟样本的变量的变化;
6、评估模型:使用多种指标评估模型的效果,根据评估结果决定模型
是否拟合好;
7、再优化模型:如果需要,可以调整参数后再次重新拟合模型;
8、解释结果:根据模型结果分析多个自变量对因变量的影响程度,找
出自变量与因变量之间的关系。
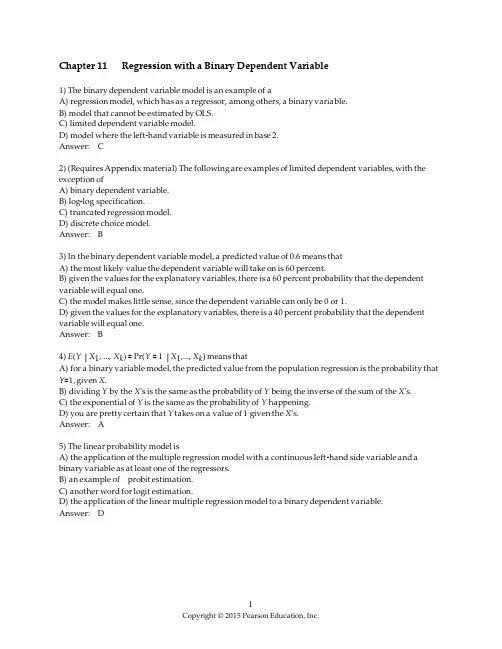
Chapter 11 Regression with a Binary Dependent Variable1) The binary dependent variable model is an example of aA) regression model, which has as a regressor, among others, a binary variable.B) model that cannot be estimated by OLS.C) limited dependent variable model.D) model where the left-hand variable is measured in base 2.Answer: C2) (Requires Appendix material) The following are examples of limited dependent variables, with the exception ofA) binary dependent variable.B) log-log specification.C) truncated regression model.D) discrete choice model.Answer: B3) In the binary dependent variable model, a predicted value of 0.6 means thatA) the most likely value the dependent variable will take on is 60 percent.B) given the values for the explanatory variables, there is a 60 percent probability that the dependent variable will equal one.C) the model makes little sense, since the dependent variable can only be 0 or 1.D) given the values for the explanatory variables, there is a 40 percent probability that the dependent variable will equal one.Answer: B4) E(Y X1, ..., X k) = Pr(Y= 1 X1,..., X k) means thatA) for a binary variable model, the predicted value from the population regression is the probability that Y=1, given X.B) dividing Y by the X's is the same as the probability of Y being the inverse of the sum of the X's.C) the exponential of Y is the same as the probability of Y happening.D) you are pretty certain that Y takes on a value of 1 given the X's.Answer: A5) The linear probability model isA) the application of the multiple regression model with a continuous left-hand side variable and a binary variable as at least one of the regressors.B) an example of probit estimation.C) another word for logit estimation.D) the application of the linear multiple regression model to a binary dependent variable.Answer: D6) In the linear probability model, the interpretation of the slope coefficient isA) the change in odds associated with a unit change in X, holding other regressors constant.B) not all that meaningful since the dependent variable is either 0 or 1.C) the change in probability that Y=1 associated with a unit change in X, holding others regressors constant.D) the response in the dependent variable to a percentage change in the regressor.Answer: C7) The following tools from multiple regression analysis carry over in a meaningful manner to the linear probability model, with the exception of theA) F-statistic.B) significance test using the t-statistic.C) 95% confidence interval using ± 1.96 times the standard error.D) regression R2.Answer: D8) (Requires material from Section 11.3 – possibly skipped) For the measure of fit in your regression model with a binary dependent variable, you can meaningfully use theA) regression R2.B) size of the regression coefficients.C) pseudo R2.D) standard error of the regression.Answer: C9) The major flaw of the linear probability model is thatA) the actuals can only be 0 and 1, but the predicted are almost always different from that.B) the regression R2 cannot be used as a measure of fit.C) people do not always make clear-cut decisions.D) the predicted values can lie above 1 and below 0.Answer: D10) The probit modelA) is the same as the logit model.B) always gives the same fit for the predicted values as the linear probability model for values between0.1 and 0.9.C) forces the predicted values to lie between 0 and 1.D) should not be used since it is too complicated.Answer: C11) The logit model derives its name fromA) the logarithmic model.B) the probit model.C) the logistic function.D) the tobit model.Answer: C12) In the probit model Pr(Y= 1=Φ(β0+β1X), ΦA) is not defined for Φ(0).B) is the standard normal cumulative distribution function.C) is set to 1.96.D) can be computed from the standard normal density function.Answer: B13) In the expression Pr(Y= 1=Φ(β0+β1X),A) (β0+β1X) plays the role of z in the cumulative standard normal distribution function.B) β1 cannot be negative since probabilities have to lie between 0 and 1.C) β0 cannot be negative since probabilities have to lie between 0 and 1.D) min (β0+β1X)> 0 since probabilities have to lie between 0 and 1.Answer: A14) In the probit model Pr(Y= 1X1, X2,..., X k) =Φ(β0+β1X1+βx X2+ ... +βk X k),A) the β's do not have a simple interpretation.B) the slopes tell you the effect of a unit increase in X on the probability of Y.C) β0 cannot be negative since probabilities have to lie between 0 and 1.D) β0 is the probability of observing Y when all X's are 0Answer: A15) In the expression Pr(deny= 1 P/I Ratio, black) =Φ(–2.26 + 2.74P/I ratio+ 0.71black), the effect ofincreasing the P/I ratio from 0.3 to 0.4 for a white personA) is 0.274 percentage points.B) is 6.1 percentage points.C) should not be interpreted without knowledge of the regression R2.D) is 2.74 percentage points.Answer: B16) The maximum likelihood estimation method produces, in general, all of the following desirable properties with the exception ofA) efficiency.B) consistency.C) normally distributed estimators in large samples.D) unbiasedness in small samples.Answer: D17) The logit model can be estimated and yields consistent estimates if you are usingA) OLS estimation.B) maximum likelihood estimation.C) differences in means between those individuals with a dependent variable equal to one and those with a dependent variable equal to zero.D) the linear probability model.Answer: B18) When having a choice of which estimator to use with a binary dependent variable, useA) probit or logit depending on which method is easiest to use in the software package at hand.B) probit for extreme values of X and the linear probability model for values in between.C) OLS (linear probability model) since it is easier to interpret.D) the estimation method which results in estimates closest to your prior expectations.Answer: A19) Nonlinear least squaresA) solves the minimization of the sum of squared predictive mistakes through sophisticated mathematical routines, essentially by trial and error methods.B) should always be used when you have nonlinear equations.C) gives you the same results as maximum likelihood estimation.D) is another name for sophisticated least squares.Answer: A20) (Requires Advanced material) Only one of the following models can be estimated by OLS:A) Y=AKαLβ+u.B) Pr(Y= 1 X) =Φ(β0+β1X)C) Pr(Y= 1 X) =F(β0+β1X) =.D) Y=AKα Lβu.Answer: D21) (Requires Advanced material) Nonlinear least squares estimators in general are notA) consistent.B) normally distributed in large samples.C) efficient.D) used in econometrics.Answer: C22) (Requires Advanced material) Maximum likelihood estimation yields the values of the coefficients thatA) minimize the sum of squared prediction errors.B) maximize the likelihood function.C) come from a probability distribution and hence have to be positive.D) are typically larger than those from OLS estimation.Answer: B23) To measure the fit of the probit model, you should:A) use the regression R2.B) plot the predicted values and see how closely they match the actuals.C) use the log of the likelihood function and compare it to the value of the likelihood function.D) use the fraction correctly predicted or the pseudo R2.Answer: D24) When estimating probit and logit models,A) the t-statistic should still be used for testing a single restriction.B) you cannot have binary variables as explanatory variables as well.C) F-statistics should not be used, since the models are nonlinear.D) it is no longer true that the 2<R2.Answer: A25) The following problems could be analyzed using probit and logit estimation with the exception of whether or notA) a college student decides to study abroad for one semester.B) being a female has an effect on earnings.C) a college student will attend a certain college after being accepted.D) applicants will default on a loan.Answer: B26) In the probit regression, the coefficient β1 indicatesA) the change in the probability of Y= 1 given a unit change in XB) the change in the probability of Y= 1 given a percent change in XC) the change in the z- value associated with a unit change in XD) none of the aboveAnswer: C27) Your textbook plots the estimated regression function produced by the probit regression of deny onP/I ratio. The estimated probit regression function has a stretched "S" shape given that the coefficient on the P/I ratio is positive. Consider a probit regression function with a negative coefficient. The shape wouldA) resemble an inverted "S" shape (for low values of X, the predicted probability of Y would approach1)B) not exist since probabilities cannot be negativeC) remain the "S" shape as with a positive slope coefficientD) would have to be estimated with a logit functionAnswer: A28) Probit coefficients are typically estimated usingA) the OLS methodB) the method of maximum likelihoodC) non-linear least squares (NLLS)D) by transforming the estimates from the linear probability modelAnswer: B29) F-statistics computed using maximum likelihood estimatorsA) cannot be used to test joint hypothesisB) are not meaningful since the entire regression R2 concept is hard to apply in this situationC) do not follow the standard F distributionD) can be used to test joint hypothesisAnswer: D30) When testing joint hypothesis, you can useA) the F- statisticB) the chi-squared statisticC) either the F-statistic or the chi-square statisticD) none of the aboveAnswer: C。

多元线性回归与多项式回归第九章 多元线性回归与多项式回归直线回归研究的是一个依变量与一个自变量之间的回归问题,但是,在畜禽、水产科学领域的许多实际问题中,影响依变量的自变量往往不止一个,而是多个,比如绵羊的产毛量这一变量同时受到绵羊体重、胸围、体长等多个变量的影响,因此需要进行一个依变量与多个自变量间的回归分析,即多元回归分析(multiple regression analysis ),而其中最为简单、常用并且具有基础性质的是多元线性回归分析(multiple linear regression analysis ),许多非线性回归(non-linear regression )和多项式回归(polynomial regression )都可以化为多元线性回归来解决,因而多元线性回归分析有着广泛的应用。
研究多元线性回归分析的思想、方法和原理与直线回归分析基本相同,但是其中要涉及到一些新的概念以及进行更细致的分析,特别是在计算上要比直线回归分析复杂得多,当自变量较多时,需要应用电子计算机进行计算。
aaa第一节 多元线性回归分析多元线性回归分析的基本任务包括:根据依变量与多个自变量的实际观测值建立依变量对多个自变量的多元线性回归方程;检验、分析各个自变量对依自变量的综合线性影响的显著性;检验、分析各个自变量对依变量的单纯线性影响的显著性,选择仅对依变量有显著线性影响的自变量,建立最优多元线性回归方程;评定各个自变量对依变量影响的相对重要性以及测定最优多元线性回归方程的偏离度等。
一、 多元线性回归方程的建立(一)多元线性回归的数学模型 设依变量y 与自变量1x 、2x 、…、m x 共有n 组实际观测数据:假定依变量y 与自变量x 1、x 2、…、x m 间存在线性关系,其数学模型为:j mj m j j j x x x y εββββ+++++=...22110 (9-1)(j =1,2,…,n )式中,x 1、x 2、…、x m 为可以观测的一般变量(或为可以观测的随机变量);y 为可以观测的随机变量,随x 1、x 2、…、x m 而变,受试验误差影响;j ε为相互独立且都服从),0(2σN 的随机变量。

多元线性回归名词解释多元线性回归(MultipleLinearRegression)是一种统计学模型,主要用来分析自变量和因变量之间的关系,它可以反映出某一种现象所依赖的多个自变量,从而更好地分析和捕捉它们之间的关系。
它是回归分析法的一种,是以线性方程拟合多个自变量和一个因变量之间的关系,是统计分析中用来探索和预测因变量之间自变量的变化情况的常用方法之一。
例如,可以利用多元线性回归来分析教育水平,收入水平和住房价格之间的关系,以及社会状况下的因素对收入水平的影响等等。
多元线性回归有两种形式:一种是多元普通最小二乘法(Ordinary Least Squares,OLS),另一种是多元最小平方根法(Root Mean Square)。
多元普通最小二乘法是将解释变量和因变量之间的关系用线性函数来拟合,从而求解最优模型参数;而多元最小平方根法是将解释变量和因变量之间的关系用一条曲线来拟合,从而求解最优模型参数。
多元线性回归可以用于描述一个变量与多个自变量之间的关系,并可以用来预测一个变量的变化情况。
它的优势在于可以计算出各自变量对因变量的相对贡献度,从而更有效地分析它们之间的关系,以及对复杂的数据更好地进行预测。
然而,多变量线性回归也存在一些缺点,其中最常见的是异方差假设,即解释变量和因变量之间观察值的方差相等。
此外,多元线性回归也受到异常值的干扰,存在多重共线性现象,可能引发过拟合或欠拟合等问题。
因此,在使用多元线性回归时,应该遵循良好的统计原则,如检验异方差假设、检验异常值以及检验多重共线性等,这样才能更准确地预测和分析数据。
总之,多元线性回归是一种分析多个自变量与一个因变量之间关系的统计学模型,可以有效地检验假设,从而预测和分析数据。
它可以反映出某一种现象所依赖的多个自变量,从而更好地分析和捕捉它们之间的关系。
它也有许多缺点,应该遵循良好的统计原则,如检验异方差假设、检验异常值以及检验多重共线性等,以准确地预测和分析数据。
多元回归模型简介多元回归模型(Multiple Regression Model)是一种用于分析多个自变量与一个因变量之间关系的统计模型。
它可以用于预测和解释因变量的变化,并确定自变量对因变量的影响程度。
多元回归模型在许多领域中都得到广泛应用,特别是在经济学、金融学、社会科学和自然科学等领域。
它可以帮助研究人员找出多个自变量对一个因变量的综合影响,从而提供更准确的预测和解释。
建立多元回归模型的步骤建立多元回归模型一般包括以下几个步骤:1.收集数据:收集自变量和因变量的数据,并确保数据的完整性和准确性。
2.数据预处理:对数据进行清洗和处理,包括处理缺失值、异常值和离群值等。
3.确定自变量和因变量:根据研究目的和领域知识,确定自变量和因变量。
4.拟合回归模型:选择合适的回归模型,并使用最小二乘法等方法拟合回归模型。
5.模型评估:通过分析回归系数、残差、拟合优度等指标来评估模型的拟合效果。
6.解释结果:根据回归模型的系数和统计显著性,解释自变量对因变量的影响。
多元回归模型的方程多元回归模型可表示为以下方程:Y = β0 + β1X1 + β2X2 + … + βk*Xk + ε其中,Y表示因变量,X1、X2、…、Xk表示自变量,β0、β1、β2、…、βk表示回归系数,ε为误差项。
回归系数β0表示截距,表示当所有自变量为0时,因变量的值。
回归系数βi表示自变量Xi对因变量的影响,即当自变量Xi增加一个单位时,因变量的平均变化量。
误差项ε表示模型无法解释的部分,代表了观测误差和模型中遗漏的影响因素。
多元回归模型的拟合和评估拟合多元回归模型的常用方法是最小二乘法(Ordinary Least Squares,OLS)。
最小二乘法通过最小化观测值和模型预测值之间的残差平方和,找到最佳拟合的回归系数。
拟合好的多元回归模型应具备以下特征:1.较小的残差:模型的残差应该较小,表示模型能够较好地拟合数据。
2.显著的回归系数:回归系数应该达到统计显著性水平,表示自变量对因变量的影响是真实存在的。
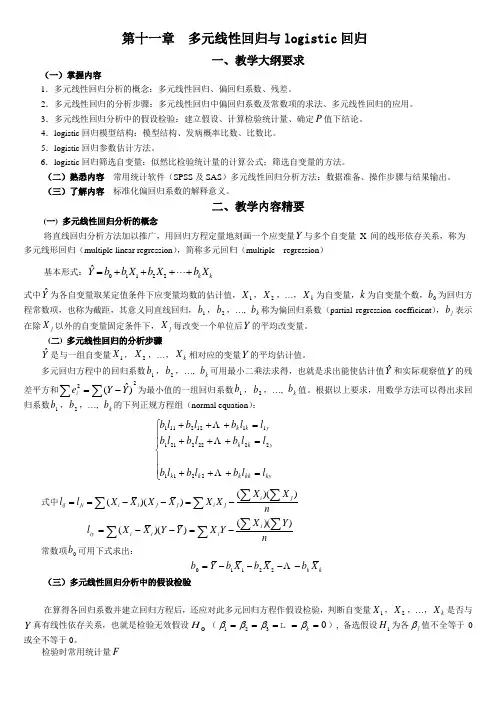
第十一章 多元线性回归与logistic 回归一、教学大纲要求(一)掌握内容1.多元线性回归分析的概念:多元线性回归、偏回归系数、残差。
2.多元线性回归的分析步骤:多元线性回归中偏回归系数及常数项的求法、多元线性回归的应用。
3.多元线性回归分析中的假设检验:建立假设、计算检验统计量、确定P 值下结论。
4.logistic 回归模型结构:模型结构、发病概率比数、比数比。
5.logistic 回归参数估计方法。
6.logistic 回归筛选自变量:似然比检验统计量的计算公式;筛选自变量的方法。
(二)熟悉内容 常用统计软件(SPSS 及SAS )多元线性回归分析方法:数据准备、操作步骤与结果输出。
(三)了解内容 标准化偏回归系数的解释意义。
二、教学内容精要(一) 多元线性回归分析的概念将直线回归分析方法加以推广,用回归方程定量地刻画一个应变量Y 与多个自变量X 间的线形依存关系,称为多元线形回归(multiple linear regression ),简称多元回归(multiple regression )基本形式:01122ˆk kY b b X b X b X =+++⋅⋅⋅+ 式中Y ˆ为各自变量取某定值条件下应变量均数的估计值,1X ,2X ,…,k X 为自变量,k 为自变量个数,0b 为回归方程常数项,也称为截距,其意义同直线回归,1b ,2b ,…, k b 称为偏回归系数(partial regression coefficient ),j b 表示在除j X 以外的自变量固定条件下,j X 每改变一个单位后Y 的平均改变量。
(二) 多元线性回归的分析步骤Y ˆ是与一组自变量1X ,2X ,…,kX 相对应的变量Y 的平均估计值。
多元回归方程中的回归系数1b ,2b ,…, k b 可用最小二乘法求得,也就是求出能使估计值Yˆ和实际观察值Y 的残差平方和22)ˆ(∑∑-=Y Y e i 为最小值的一组回归系数1b ,2b ,…, k b 值。

多元逐步回归模型(multiple regression stepwise model)是一种有效地建立多元线性回归模型的方法,它采用逐步搜索的方法来选择有效的解释变量,以构建最优的多元线性回归模型。
它可以消除由于多重共线性而导致的解释变量选择问题,使得模型更加简洁,更具有解释性。
多元逐步回归模型的步骤:
(1)将所有可能的解释变量放入模型中,进行回归分析,以确定模型的总体拟合效果。
(2)在给定的解释变量中,选择与因变量最具有解释性的一个变量,以及它的各个水平下的因变量的平均值,并放入模型中。
(3)逐步添加其他解释变量,比较每一步模型的解释力,只有当添加该解释变量后,模型的解释力显著提高时,才选择将该解释变量加入模型中。
(4)重复以上步骤,按照解释力添加解释变量,直至模型的解释力不能显著提高,则终止搜索。
多元逐步回归模型是指在估计回归模型时,将多个解释变量一步一步加入,以最小化残差平方和的过程。
这种类型的回归模型被称为多元逐步回归,是建立关于多个变量之间因果关系的有效方法。
多元逐步回归模型确定变量之间的关系,以及变量与响应变量之间的关系,这样可以更好地控制和预测变量的影响。
这种模型的优势在于,它能够更准确地衡量变量之间的关系,并有助于更好地控制变量的影响。
多元线性回归(multiple linear regression)Multiple linear regression in data miningContent:Review of 2.1 linear regression2.2 cases of regression processSubset selection in 2.3 linear regressionPerhaps the most popular and predictive mathematical model is the multivariate linear regression model. You're already in the data, modelIn the course of decision making, we studied the multiple linear regression model. In this statement, we will build on the basis of these knowledgeThe test applies multiple linear regression model in data mining. Multiple linear regression models are used for numerical data mining situationsIn. For example, demographic and historical behavior models are used to predict customer use of credit cards, based on usage and their environmentTo forecast the equipment failure time, often in the past through the travel vacation travel expenses forecast record, at the inquiry officeWindow through the history, product sales, information and other staff forecast the needs of workers, through historical information to predict cross sales of product salesAnd to predict the impact of discounts on sales in retail.In this note, we review the process of multiple linear regression. Here we stress the need to divide data into two categories: TrainingThe data set and the validation data set make it possible to validate multiple linear regression models and require a loose assumption: error obeysNormal distribution. After these reviews, we introduce methods for determining subsets of independent variables to improve prediction.An overview of 2.1 linear regressionIn this discussion, we briefly review the multivariate linear models encountered in the course of data, models, and decision making. AA continuous random variable is called a dependent variable, Y, and some independent variables,. Our purpose is to use independent variablesA linear equation that predicts the value of a dependent variable (also known as a response variable). The modulus that is known as the independent variable for the prediction purposeType is:Pxxx, (21)Epsilon, beta, beta, beta, +++++=ppxxxY,... 22110 (1)Wherein, epsilon is a "noise" variable, which is a normal distribution with a mean value of 0 and a standard deviation of delta (we don't know its value)Random variable. We don't know the values of these coefficients, P, beta, beta,..., 10. We estimate all of these from the data obtained(p+2) the value of an unknown parameter.These data include the N line observation points, also known as instances, which are represented as instances;. throughThese estimates of the beta coefficients are calculated by minimizing the variance and minimum of the values between the predicted and observed data. Variance sumIs expressed as follows:Ipiiixxxy,...,, 21ni,..., 2,1=Sigma =....Nippiiixxxy1222110) (beta, beta, beta)Let us represent the value of the coefficients by making the upper type minimized. These are our estimates of the unknown values,''2'1'0,...,, P, beta, beta, betaThe estimator is also referred to in the literature as OLS (ordinary least squares). Once we have calculated these estimates,We can use the following formula to compute unbiased estimates:^ ^1^0, -, P, beta, beta 2, Delta 2^, DeltaObservation point factorResiduals and = =...= = SigmaNiippiiixxxypn12221102^()...11, beta, beta, beta DeltaThe values we insert in the linear regression model (1) are based on the values of the known independent variablesPredict the value of dependent variable. The predictor variables are calculated according to the following formula:^ ^1^0,..., P, beta, beta, pxxx,..., 21^YPpxxxY^2^21^1^0^Beta beta beta beta ++++=...In the sense that they are unbiased estimates (the mean is true) and that there is a minimum variance compared with other biased estimates,The predictions based on this formula are the best possiblepredictive values if we make the following assumptions:1. Linear hypothesis: the expected value of dependent variable is a linear equation about the independent variablePppxxxxxxYE beta beta beta beta ++++=...), | (2211021,...2, independence hypothesis: random noise variable I epsilonIndependent in all lines. Here I epsilonThe noise is observed at the first I observation pointMachine variable, i=1,2,... N;3. Unbiased hypothesis: noise stochastic variable I epsilonThe expected value is 0, that is, for i=1,2,... N has 0) (=iE epsilon);4, the same variance hypothesis: for i=1,2,... And n's I epsilonThe standard deviation has the same value as delta;5. Normality hypothesis: noise stochastic variable I epsilonNormal distribution.There is an important and interesting fact for our purpose, that is, even if we give up the hypothesis of normalitySet 5) and allow noise variables to obey arbitrary distributions, and these estimates are still well predicted. We can watch BenQThe prediction of these estimators is the best linear predictor due to their minimum expected variance. In other words, in all linear modelsAnd, as defined in equation (1), the model uses a least squares estimator,^ ^1^0, -, P, beta, betaWe will give the minimum of the mean square. And describe the idea in detail in the next section.Normal distribution assumptions are used to derive confidence intervals for predictions. In data mining applications, we have two different data sets:The training data set and the validation data set, these two data sets contain typical relationships between independent variables and dependent variables. Training dataSets are used to estimate regression coefficients. Validation data sets are used to form retention samples without calculating regression coefficientsEstimated value. This allows us to estimate the errors in our predictions without assuming that the noise variables are normally distributedPoor. We use training data to fit the model and estimate the coefficients. These estimated coefficients are used for all validation data setsExamples make predictions. Compare the actual dependent variable values for each example's prediction and validation data sets. The mean square difference allows usCompare the different models and estimate the accuracy of the model in forecasting.^ ^1^0, -, P, beta, beta2.2 cases of regression processWe use examples from Chaterjee, Hadi, and Price to evaluate the performance of managers in big financial institutionsThe process of multivariate linear regression is shown.The data shown in Table 2.1 are derived from a survey of office staff at a department of a major financial institutionSub. Dependent variable is a measure of the efficiency of a department leading by the agency's managers. All dependent variables and independent variables are25 employees are graded from 1 to 5 in different aspects of the management's work. As a result, for each variableThe minimum is 25 and the maximum is 125. These ratings are a survey of 25 employees in each department and 30 employees in each departmentAnswer。
多元回归分析结果解读一、多元回归分析简介用回归方程定量地刻画一个应变量与多个自变量间的线性依存关系,称为多元回归分析(multiple linear regression),简称多元回归(multiple regression)。
多元回归分析是多变量分析的基础,也是理解监督类分析方法的入口!实际上大部分学习统计分析和市场研究的人的都会用回归分析,操作也是比较简单的,但能够知道多元回归分析的适用条件或是如何将回归应用于实践,可能还要真正领会回归分析的基本思想和一些实际应用手法!回归分析的基本思想是:虽然自变量和因变量之间没有严格的、确定性的函数关系,但可以设法找出最能代表它们之间关系的数学表达形式。
二、多元回归线性分析的运用具体地说,多元线性回归分析主要解决以下几方面的问题。
(1)确定几个特定的变量之间是否存在相关关系,如果存在的话,找出它们之间合适的数学表达式;(2)根据一个或几个变量的值,预测或控制另一个变量的取值,并且可以知道这种预测或控制能达到什么样的精确度;(3)进行因素分析。
例如在对于共同影响一个变量的许多变量(因素)之间,找出哪些是重要因素,哪些是次要因素,这些因素之间又有什么关系等等。
在运用多元线性回归时主要需要注意以下几点:首先,多元回归分析应该强调是多元线性回归分析!强调线性是因为大部分人用回归都是线性回归,线性的就是直线的,直线的就是简单的,简单的就是因果成比例的;理论上讲,非线性的关系我们都可以通过函数变化线性化,就比如:Y=a+bLnX,我们可以令t=LnX,方程就变成了Y=a+bt,也就线性化了。
第二,线性回归思想包含在其它多变量分析中,例如:判别分析的自变量实际上是回归,尤其是Fisher线性回归方程;Logistics回归的自变量也是回归,只不过是计算线性回归方程的得分进行了概率转换;甚至因子分析和主成分分析最终的因子得分或主成分得分也是回归算出来的;当然,还有很多分析最终也是回归思想!第三:什么是“回归”,回归就是向平均靠拢。
计量经济学名词解释计量经济学是研究经济现象和经济理论运用数学和统计学方法进行定量分析的学科。
下面是一些计量经济学常用的名词及其解释。
1. 回归分析(Regression Analysis):回归分析是计量经济学中最常用的一种定量方法,用于研究因变量与一个或多个自变量之间的关系。
通常通过估计回归方程来进行分析,并使用统计方法评估估计结果的可信度。
2. 多元回归(Multiple Regression):多元回归是回归分析的一种扩展形式,用于研究因变量与多个自变量之间的关系。
多元回归可以更准确地解释和预测因变量,但也需要更多的数据和更复杂的统计分析。
3. 面板数据(Panel Data):面板数据是指在一段时间内对多个个体或单位进行多次观测的数据。
计量经济学通过面板数据可以分析个体间的差异和个体内部的动态变化,提供了更丰富的信息。
4. 差分法(Difference-in-Differences):差分法是一种处理定量数据的方法,用于评估某个政策或干预对于因变量的影响。
该方法通过比较干预组与非干预组的变化差异来分析干预的效果。
5. 处理选择偏误(Selection Bias):处理选择偏误是指由于个体自愿参与某个处理或实验,导致样本不代表总体的情况。
计量经济学使用各种方法来解决处理选择偏误,以确保研究结果的准确性。
6. 仪器变量(Instrumental Variables):仪器变量是一种用于解决内生性问题的方法。
在计量经济学中,内生性指的是自变量与误差项存在相关关系。
仪器变量通过引入与自变量相关但与误差项不相关的变量来解决内生性问题,提高估计结果的准确性。
7. 广义矩估计(Generalized Method of Moments,GMM):广义矩估计是一种估计模型参数的方法,它基于矩条件的经济模型,通过最大化矩条件以估计未知参数。
广义矩估计不需要对误差项分布做出强假设,适用于更广泛的经济模型。
8. 时间序列分析(Time Series Analysis):时间序列分析是研究一系列时间上连续排列的观测值的经济统计方法。
multiple用法及搭配
1. 形容词,表示多个、多种、多次或多方面的。
例如:multiple choices (多项选择)、multiple locations (多个地点)、multiple meanings (多重含义)、multiple times (多次)、multiple factors (多种因素)。
2. 名词,表示多项选择题。
例如:I have to answer multiple in this exam (我必须在这个考试中回答多项选择题)。
3. 副词,表示多次、重复地进行某种行动。
例如:She checked her phone multiple times (她多次查看她的手机)。
4. 动词(to multiply),表示乘、繁殖等意义。
与multiple相关的搭配词汇:
1. multiple answers: 多个答案
2. multiple effects: 多种效应
3. multiple meanings: 多重含义
4. multiple sclerosis: 多发性硬化症
5. multiple choice: 多项选择
6. multiple regression: 多元回归
7. multiple personality disorder: 多重人格障碍
8. multiple intelligences: 多元智能
9. multiple exposure: 多重曝光
10. multiple myeloma: 多发性骨髓瘤。
第十一章 多元线性回归与logistic 回归一、教学大纲要求(一)掌握内容1.多元线性回归分析的概念:多元线性回归、偏回归系数、残差。
2.多元线性回归的分析步骤:多元线性回归中偏回归系数及常数项的求法、多元线性回归的应用。
3.多元线性回归分析中的假设检验:建立假设、计算检验统计量、确定P 值下结论。
4.logistic 回归模型结构:模型结构、发病概率比数、比数比。
5.logistic 回归参数估计方法。
6.logistic 回归筛选自变量:似然比检验统计量的计算公式;筛选自变量的方法。
(二)熟悉内容 常用统计软件(SPSS 及SAS )多元线性回归分析方法:数据准备、操作步骤与结果输出。
(三)了解内容 标准化偏回归系数的解释意义。
二、教学内容精要(一) 多元线性回归分析的概念将直线回归分析方法加以推广,用回归方程定量地刻画一个应变量Y 与多个自变量X 间的线形依存关系,称为多元线形回归(multiple linear regression ),简称多元回归(multiple regression )基本形式:01122ˆk kY b b X b X b X =+++⋅⋅⋅+ 式中Y ˆ为各自变量取某定值条件下应变量均数的估计值,1X ,2X ,…,k X 为自变量,k 为自变量个数,0b 为回归方程常数项,也称为截距,其意义同直线回归,1b ,2b ,…, k b 称为偏回归系数(partial regression coefficient ),j b 表示在除j X 以外的自变量固定条件下,j X 每改变一个单位后Y 的平均改变量。
(二) 多元线性回归的分析步骤Y ˆ是与一组自变量1X ,2X ,…,kX 相对应的变量Y 的平均估计值。
多元回归方程中的回归系数1b ,2b ,…, k b 可用最小二乘法求得,也就是求出能使估计值Yˆ和实际观察值Y 的残差平方和22)ˆ(∑∑-=Y Y e i 为最小值的一组回归系数1b ,2b ,…, k b 值。
多元线性回归方法及其应用实例多元线性回归方法(Multiple Linear Regression)是一种广泛应用于统计学和机器学习领域的回归分析方法,用于研究自变量与因变量之间的关系。
与简单线性回归不同,多元线性回归允许同时考虑多个自变量对因变量的影响。
多元线性回归建立了自变量与因变量之间的线性关系模型,通过最小二乘法估计回归系数,从而预测因变量的值。
其数学表达式为:Y=β0+β1X1+β2X2+...+βnXn+ε,其中Y是因变量,Xi是自变量,βi是回归系数,ε是误差项。
1.房价预测:使用多个自变量(如房屋面积、地理位置、房间数量等)来预测房价。
通过建立多元线性回归模型,可以估计出各个自变量对房价的影响权重,从而帮助房产中介或购房者进行房价预测和定价。
2.营销分析:通过分析多个自变量(如广告投入、促销活动、客户特征等)与销售额之间的关系,可以帮助企业制定更有效的营销策略。
多元线性回归可以用于估计各个自变量对销售额的影响程度,并进行优化。
3.股票分析:通过研究多个自变量(如市盈率、市净率、经济指标等)与股票收益率之间的关系,可以辅助投资者进行股票选择和投资决策。
多元线性回归可以用于构建股票收益率的预测模型,并评估不同自变量对收益率的贡献程度。
4.生理学研究:多元线性回归可应用于生理学领域,研究多个自变量(如年龄、性别、体重等)对生理指标(如心率、血压等)的影响。
通过建立回归模型,可以探索不同因素对生理指标的影响,并确定其重要性。
5.经济增长预测:通过多元线性回归,可以将多个自变量(如人均GDP、人口增长率、外商直接投资等)与经济增长率进行建模。
这有助于政府和决策者了解各个因素对经济发展的影响力,从而制定相关政策。
在实际应用中,多元线性回归方法有时也会面临一些挑战,例如共线性(多个自变量之间存在高度相关性)、异方差性(误差项方差不恒定)、自相关(误差项之间存在相关性)等问题。
为解决这些问题,研究人员提出了一些改进和扩展的方法,如岭回归、Lasso回归等。
“回归分析”回归(regression):发生倒退或表现倒退;常指趋于接近或退回到中间状态。
在线性回归中,回归指各个观察值都围绕、靠近估计直线的现象。
多元回归模型(multiple regression model):包含多个自变量的回归模型,用于分析一个因变量与多个自变量之间的关系。
它与一元回归模型的区别在于,多元回归模型体现了统计控制的思想。
因变量(dependent variable):也称为依变量或结果变量,它随着自变量的变化而变化。
从试验设计角度来讲,因变量也就是被试的反应变量,它是自变量造成的结果,是主试观测或测量的行为变量。
自变量(independent variable):在一项研究中被假定作为原因的变量,能够预测其他变量的值,并且在数值或属性上可以改变。
随机变量(random variable):即随机事件的数量表现。
这种变量在不同的条件下由于偶然因素影响,可能取各种不同的值,具有不确定性和随机性,但这些取值落在某个范围的概率是一定的。
连续变量(continuous variable):在一定区间内可以任意取值的变量,其数值是连续不断的,相邻两个数值可作无限分割,即可取无限个数值,比如身高、体重等。
名义变量(nominal variable):本身的编码不包含任何具有实际意义的数量关系,变量值之间不存在大小、加减或乘除的运算关系。
随机变量(random variable):即随机事件的数量表现。
这种变量在不同的条件下由于偶然因素影响,可能取各种不同的值,具有不确定性和随机性,但这些取值落在某个范围的概率是一定的。
截距(intercept):函数与y坐标轴的相交点,即回归方程中的常数项。
斜率(slope):即回归方程中各自变量的系数。
它表示自变量一个单位的变化所引起的因变量的变化量,如果是线性模型,则在坐标图上表现为两个变量拟合直线之斜率。
偏效应(partial effect):在控制其他变量的情况下,或者说在其他条件相同的情况下,各自变量X对因变量Y的净效应(net effect)或独特效应(unique effect)。
MR分析规则与方法MR(Multiple Regression)分析是一种统计方法,用于研究一个或多个自变量对一个因变量的影响程度。
通过建立多元回归方程,可以推断出自变量与因变量之间的关系,并对其进行定量分析。
MR分析的基本步骤包括:选择自变量和因变量、构建回归方程、进行回归分析、检验回归模型的有效性和解释回归模型。
首先,选择自变量和因变量。
要进行MR分析,需要选择一个或多个自变量,并确定一个因变量。
自变量可以是连续变量或分类变量,而因变量通常是连续变量。
然后,构建回归方程。
回归方程是MR分析的核心,用于描述自变量和因变量之间的关系。
回归方程一般采用线性模型,即因变量的预测值是自变量的线性组合。
回归方程可以包含一阶项、二阶项和交互项等。
接下来,进行回归分析。
回归分析包括参数估计、显著性检验和残差分析等。
参数估计是用于估计回归系数的值,可以通过最小二乘法进行估计。
显著性检验是用于检验回归系数是否显著不等于零,常用的方法有T 检验和F检验。
残差分析是用于检验回归模型的合理性和准确性,可以检验残差的正态性、线性性和同方差性等。
最后,检验回归模型的有效性和解释回归模型。
通过判断回归模型的拟合程度和解释力,可以评估回归模型的有效性。
拟合程度可以用决定系数(R²)来表示,解释力可以通过回归系数的解释和显著性检验来评估。
在进行MR分析时,还需要注意一些常见的问题。
首先,要注意数据的质量和可靠性,避免数据异常值和缺失值对分析结果的影响。
其次,要选择合适的自变量,并进行变量选择和转换,以优化回归模型。
此外,还要注意回归模型的拟合和解释的合理性,避免误解和错误推理。
总之,MR分析是一种常用的统计方法,可用于研究自变量对因变量的影响程度。
通过选择自变量和因变量,构建回归方程,进行回归分析,检验回归模型的有效性和解释回归模型,可以得出自变量与因变量之间的关系,并进行定量分析。
但在进行MR分析时,需要注意数据的质量、选择合适的自变量、回归模型的拟合和解释的合理性等问题。
11Multiple regressionThis chapter discusses the case of regression analysis with multiple pre-dictors.There is not really much new here since model specification and output do not differ a lot from what has been described for regression analysis and analysis of variance.The news is mainly the model search aspect,namely among a set of potential descriptive variables to look for a subset that describes the response sufficiently well.The basic model for multiple regression analysis isy=β0+β1x1+···+βk x k+where x1,...x k are explanatory variables(also called predictors)and the parametersβ1,...,βk can be estimated using the method of least squares (see Section6.1).A closed-form expression for the estimates can be derived using matrix calculus,but we do not go into the details of that here. 11.1Plotting multivariate dataAs an example in this chapter,we use a study concerning lung function in patients with cysticfibrosis in Altman(1991,p.338).The data are in the cystfibr data frame in the ISwR package.P.Dalgaard,Introductory Statistics with R,DOI:10.1007/978-0-387-79054-1_11,©Springer Science+Business Media,LLC200818611.Multiple regression age0.00.6205020401002006012020010200.00.6sexheight1101502050weightbmp 6580952040fev1rv 150300450100200frctlc8011010206012020011015065809515030045080110pemaxFigure 11.1.Pairwise plots for cystic fibrosis data.You can obtain pairwise scatterplots between all the variables in the data set.This is done using the function pairs .To get Figure 11.1,you simply write>par(mex=0.5)>pairs(cystfibr,gap=0,bels=0.9)The arguments gap and bels control the visual appearance by removing the space between subplots and decreasing the font size.The mex graphics parameter reduces the interline distance in the margins.A similar plot is obtained by simply saying plot(cystfibr)since the plot function is generic and behaves differently depending on the class of its arguments (see Section 2.3.2).Here the argument is a data frame and a pairs plot is a fairly reasonable thing to get when asking for a plot of an11.2Model specification and output187 entire data frame(although you might equally reasonably have expected a histogram or a barchart of each variable instead).The individual plots do get rather small,probably not suitable for di-rect publication,but such plots are quite an effective way of obtaining an overview of multidimensional issues.For example,the close relations among age,height,and weight appear clearly on the plot.In order to be able to refer directly to the variables in cystfibr,we add it to the search path(a harmless warning about masking of tlc ensues at this point):>attach(cystfibr)Because this data set contains common variable names such as age, height,and weight,it is a good idea to ensure that you do not have identically named variables in the workspace at this point.In particular, such names were used in the introductory session.11.2Model specification and outputSpecification of a multiple regression analysis is done by setting up a model formula with+between the explanatory variables:lm(pemax~age+sex+height+weight+bmp+fev1+rv+frc+tlc)which is meant to be read as“pemax is described using a model that is additive in age,sex,and so forth.”(pemax is the maximal expira-tory pressure.See Appendix B for a description of the other variables in cystfibr.)As usual,there is not much output from lm itself,but with the aid of summary you can obtain some more interesting output:>summary(lm(pemax~age+sex+height+weight+bmp+fev1+rv+frc+tlc))Call:lm(formula=pemax~age+sex+height+weight+bmp+fev1+ rv+frc+tlc)Residuals:Min1Q Median3Q Max-37.338-11.532 1.08113.38633.405Coefficients:Estimate Std.Error t value Pr(>|t|)(Intercept)176.0582225.89120.7790.44818811.Multiple regressionage-2.5420 4.8017-0.5290.604sex-3.736815.4598-0.2420.812height-0.44630.9034-0.4940.628weight 2.9928 2.0080 1.4900.157bmp-1.7449 1.1552-1.5100.152fev1 1.0807 1.0809 1.0000.333rv0.19700.1962 1.0040.331frc-0.30840.4924-0.6260.540tlc0.18860.49970.3770.711Residual standard error:25.47on15degrees of freedomMultiple R-squared:0.6373,Adjusted R-squared:0.4197F-statistic: 2.929on9and15DF,p-value:0.03195The layout should be well known by now.Notice that there is not one single significant t value,but the joint F test is nevertheless significant, so there must be an effect somewhere.The reason is that the t tests only say something about what happens if you remove one variable and leave in all the others.You cannot see whether a variable would be statistically significant in a reduced model;all you can see is that no variable must be included.Note further that there is quite a large difference between the unadjusted and the adjusted R2,which is due to the large number of variables relative to the number of degrees of freedom for the variance.Recall that the for-mer is the change in residual sum of squares relative to an empty model, whereas the latter is the similar change in residual variance:>1-25.5^2/var(pemax)[1]0.4183949The25.5comes from“residual standard error”in the summary output. The ANOVA table for a multiple regression analysis is obtained using anova and gives a rather different picture:>anova(lm(pemax~age+sex+height+weight+bmp+fev1+rv+frc+tlc))Analysis of Variance TableResponse:pemaxDf Sum Sq Mean Sq F value Pr(>F)age110098.510098.515.56610.001296**sex1955.4955.4 1.47270.243680height1155.0155.00.23890.632089weight1632.3632.30.97470.339170bmp12862.22862.2 4.41190.053010.fev111549.11549.1 2.38780.143120rv1561.9561.90.86620.366757frc1194.6194.60.29990.592007tlc192.492.40.14240.711160Residuals159731.2648.711.2Model specification and output189 ---Signif.codes:0‘***’0.001‘**’0.01‘*’0.05‘.’0.1‘’1 Note that,except for the very last line(“tlc”),there is practically no correspondence between these F tests and the t tests from summary.In particular,the effect of age is now significant.That is because these tests are successive;they correspond to(reading upward from the bottom)a stepwise removal of terms from the model untilfinally only age is left. During the process,bmp came close to the magical5%limit,but in view of the number of tests,this is hardly noteworthy.The probability that one out of eight independent tests gives a p-value of 0.053or below is actually just over35%!The tests in the ANOVA table are not completely independent,but the approximation should be good. The ANOVA table indicates that there is no significant improvement of the model once age is included.It is possible to perform a joint test for whether all the other variables can be removed by adding up the sums of squares contributions and using the sum for an F test;that is,>955.4+155.0+632.3+2862.2+1549.1+561.9+194.6+92.4[1]7002.9>7002.9/8[1]875.3625>875.36/648.7[1] 1.349407>1-pf(1.349407,8,15)[1]0.2935148This corresponds to collapsing the eight lines of the table so that it would look like this:Df Sum Sq Mean Sq F Pr(>F)age110098.510098.515.5660.00130others87002.9875.4 1.3490.29351Residual159731.2648.7(Note that this is“cheat output”,in which we have manually inserted the numbers computed above.)A procedure leading directly to the result is>m1<-lm(pemax~age+sex+height+weight+bmp+fev1+rv+frc+tlc)>m2<-lm(pemax~age)>anova(m1,m2)Analysis of Variance TableModel1:pemax~age+sex+height+weight+bmp+fev1+rv+ frc+tlcModel2:pemax~age19011.Multiple regressionRes.Df RSS Df Sum of Sq F Pr(>F)1159731.222316734.2-8-7002.9 1.34930.2936which gives the appropriate F test with no manual computation. Notice,however,that you need to be careful to ensure that the two models are actually nested.R does not check this,although it does verify that the number of response observations is the same to safeguard against the more obvious mistakes.(When there are missing values in the descriptive variables,it’s easy for the smaller model to contain more data points.) From the ANOVA table,we can thus see that it is allowable to remove all variables except age.However,that this particular variable is left in the model is primarily due to the fact that it was mentionedfirst in the model specification,as we see below.11.3Model searchR has the step()function for performing model searches by the Akaike information criterion.Since that is well beyond the scope of this book,we use simple manual variants of backwards elimination.In the following,we go through a practical model reduction for the exam-ple data.Notice that the output has been slightly edited to take up less space.>summary(lm(pemax~age+sex+height+weight+bmp+fev1+rv+frc+tlc))...Estimate Std.Error t value Pr(>|t|)(Intercept)176.0582225.89120.7790.448age-2.5420 4.8017-0.5290.604sex-3.736815.4598-0.2420.812height-0.44630.9034-0.4940.628weight 2.9928 2.0080 1.4900.157bmp-1.7449 1.1552-1.5100.152fev1 1.0807 1.0809 1.0000.333rv0.19700.1962 1.0040.331frc-0.30840.4924-0.6260.540tlc0.18860.49970.3770.711...One advantage of doing model reductions by hand is that you may im-pose some logical structure on the process.In the present case,it may,for instance,be natural to try to remove other lung function indicatorsfirst. >summary(lm(pemax~age+sex+height+weight+bmp+fev1+rv+frc))11.3Model search191 ...Estimate Std.Error t value Pr(>|t|)(Intercept)221.8055185.4350 1.1960.2491age-3.1346 4.4144-0.7100.4879sex-4.693314.8363-0.3160.7558height-0.54280.8428-0.6440.5286weight 3.3157 1.7672 1.8760.0790.bmp-1.9403 1.0047-1.9310.0714.fev1 1.0183 1.03920.9800.3417rv0.18570.18870.9840.3396frc-0.26050.4628-0.5630.5813...>summary(lm(pemax~age+sex+height+weight+bmp+fev1+rv))...Estimate Std.Error t value Pr(>|t|)(Intercept)166.71822154.31294 1.0800.2951age-1.81783 3.66773-0.4960.6265sex0.1023911.899900.0090.9932height-0.409810.79257-0.5170.6118weight 2.87386 1.55120 1.8530.0814.bmp-1.949710.98415-1.9810.0640.fev1 1.415260.74788 1.8920.0756.rv0.095670.097980.9760.3425...>summary(lm(pemax~age+sex+height+weight+bmp+fev1))...Estimate Std.Error t value Pr(>|t|)(Intercept)260.6313120.5215 2.1630.0443*age-2.9062 3.4898-0.8330.4159sex-1.211511.8083-0.1030.9194height-0.60670.7655-0.7930.4384weight 3.3463 1.4719 2.2730.0355*bmp-2.30420.9136-2.5220.0213*fev1 1.02740.6329 1.6230.1219...>summary(lm(pemax~age+sex+height+weight+bmp))...Estimate Std.Error t value Pr(>|t|)(Intercept)280.4482124.9556 2.2440.0369*age-3.0750 3.6352-0.8460.4081sex-11.528110.3720-1.1110.2802height-0.68530.7962-0.8610.4001weight 3.5546 1.5281 2.3260.0312*bmp-1.96130.9263-2.1170.0476*...As is seen,there was no obstacle to removing the four lung function variables.Next we try to reduce among the variables that describe the patient’s state of physical development or size.Initially,we avoid remov-ing weight and bmp since they appear to be close to the5%significance limit.19211.Multiple regression>summary(lm(pemax~age+height+weight+bmp))...Estimate Std.Error t value Pr(>|t|)(Intercept)274.5307125.5745 2.1860.0409*age-3.0832 3.6566-0.8430.4091height-0.69850.8008-0.8720.3934weight 3.6338 1.5354 2.3670.0282*bmp-1.96210.9317-2.1060.0480*...>summary(lm(pemax~height+weight+bmp))...Estimate Std.Error t value Pr(>|t|)(Intercept)245.3936119.8927 2.0470.0534.height-0.82640.7808-1.0580.3019weight 2.7717 1.1377 2.4360.0238*bmp-1.48760.7375-2.0170.0566....>summary(lm(pemax~weight+bmp))...Estimate Std.Error t value Pr(>|t|)(Intercept)124.829737.4786 3.3310.003033**weight 1.64030.3900 4.2060.000365***bmp-1.00540.5814-1.7290.097797....>summary(lm(pemax~weight))...Estimate Std.Error t value Pr(>|t|)(Intercept)63.545612.7016 5.003 4.63e-05***weight 1.18670.3009 3.9440.000646***...Notice that,once age and height were removed,bmp was no longer sig-nificant.In the original reference(Altman,1991),weight,fev1,and bmp all ended up with p-values below5%.However,far from all elimination procedures lead to that result.It is also a good idea to pay close attention to the age,weight,and height variables,which are heavily correlated since we are dealing with children and adolescents.>summary(lm(pemax~age+weight+height))...Estimate Std.Error t value Pr(>|t|)(Intercept)64.6555582.409350.7850.441age 1.56755 3.143630.4990.623weight0.869490.85922 1.0120.323height-0.076080.80278-0.0950.925...>summary(lm(pemax~age+height))...Estimate Std.Error t value Pr(>|t|)(Intercept)17.860068.24930.2620.79611.4Exercises193age 2.7178 2.93250.9270.364height 0.33970.69000.4920.627...>summary(lm(pemax~age))...Estimate Std.Error t value Pr(>|t|)(Intercept)50.40816.657 3.0260.00601**age 4.055 1.088 3.7260.00111**...>summary(lm(pemax~height))...Estimate Std.Error t value Pr(>|t|)(Intercept)-33.275740.0445-0.8310.41453height 0.93190.2596 3.5900.00155**...As it turns out,there is really no reason to prefer one of the three variables over the two others.The fact that an elimination method ends up with a model containing only weight is essentially a coincidence.You can easily be misled by model search procedures that end up with one highly sig-nificant variable —it is far from certain that the same variable would be chosen if you were to repeat the analysis on a new,similar data set.What you may reasonably conclude is that there is probably a connection with the patient’s physical development or size,which may be described in terms of age,height,or weight.Which description to use is arbitrary.If you want to choose one over the others,a decision cannot be based on the data,although possibly on theoretical considerations and/or results from previous investigations.11.4Exercises11.1The secher data are best analyzed after log-transforming birth weight as well as the abdominal and biparietal diameters.Fit a prediction equation for birth weight.How much is gained by using both diameters in a prediction equation?The sum of the two regression coefficients is almost exactly 3—can this be given a nice interpretation?11.2The tlc data set contains a variable also called tlc .This is not in general a good idea;explain why.Describe tlc using the other variables in the data set and discuss the validity of the model.11.3The analyses of cystfibr involve sex ,which is a binary variable.How would you interpret the results for this variable?11.4Consider the juul2data set and select the group of those over 25years old.Perform a regression analysis of √igf1on age ,and extend19411.Multiple regressionthe model by including height and weight.Generate the analysis of variance table for the extended model.What is the surprise,and why does it happen?11.5Analyze and interpret the effect of explanatory variables on the milk intake in the kfm data set using a multiple regression model.Notice that sex is a factor here;what does that imply for the analyses?。