R语言基础
- 格式:doc
- 大小:712.00 KB
- 文档页数:9

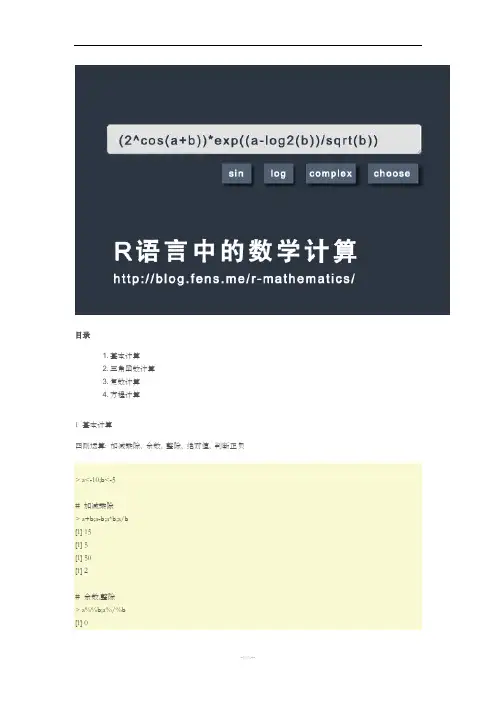
目录1. 基本计算2. 三角函数计算3. 复数计算4. 方程计算1 基本计算四则运算: 加减乘除, 余数, 整除, 绝对值, 判断正负> a<-10;b<-5# 加减乘除> a+b;a-b;a*b;a/b[1] 15[1] 5[1] 50[1] 2# 余数,整除> a%%b;a%/%b[1] 0[1] 2# 绝对值> abs(-a)[1] 10# 判断正负> sign(-2:3)[1] -1 -1 0 1 1 1数学计算: 幂, 自然常用e的幂, 平方根, 对数> a<-10;b<-5;c<-4# 幂> c^b;c^-b;c^(b/10)[1] 1024[1] 0.0009765625[1] 2# 自然常数e> exp(1)[1] 2.718282# 自然常数e的幂> exp(3)[1] 20.08554# 平方根> sqrt(c)[1] 2# 以2为底的对数> log2(c)[1] 2# 以10为底的对数> log10(b)[1] 0.69897# 自定义底的对数> log(c,base = 2)[1] 2# 自然常数e的对数> log(a,base=exp(1))[1] 2.302585# 指数对数操作> log(a^b,base=a)[1] 5> log(exp(3))[1] 3比较计算: ==, >, <, !=, <=, >=, isTRUE, identical > a<-10;b<-5# 比较计算> a==a;a!=b;a>b;a<B;A<=B;A>=c[1] TRUE[1] TRUE[1] TRUE[1] FALSE[1] FALSE[1] TRUE# 判断是否为TRUE> isTRUE(a)[1] FALSE> isTRUE(!a)[1] FALSE# 精确比较两个对象> identical(1, as.integer(1))[1] FALSE> identical(NaN, -NaN)[1] TRUE> f <- function(x) x> g <- compiler::cmpfun(f)> identical(f, g)[1] TRUE逻辑计算:&, |, &&, ||, xor> x<-c(0,1,0,1)> y<-c(0,0,1,1)# 只比较第一个元素&&, ||> x && y;x || y[1] FALSE[1] FALSE# S4对象的逻辑运算,比较所有元素&, |> x & y;x | y[1] FALSE FALSE FALSE TRUE[1] FALSE TRUE TRUE TRUE# 异或> xor(x,y)[1] FALSE TRUE TRUE FALSE> xor(x,!y)[1] TRUE FALSE FALSE TRUE约数计算:ceiling,floor,trunc,round,signif# 向上取整> ceiling(5.4)[1] 6# 向下取整> floor(5.8)[1] 5# 取整数> trunc(3.9)[1] 3# 四舍五入> round(5.8)# 四舍五入,保留2位小数> round(5.8833, 2)[1] 5.88# 四舍五入,保留前2位整数> signif(5990000,2)[1] 6e+06数组计算:最大, 最小, 范围, 求和, 均值, 加权平均, 连乘, 差分, 秩,,中位数, 分位数, 任意数,全体数> d<-seq(1,10,2);d[1] 1 3 5 7 9# 求最大值,最小值,范围range> max(d);min(d);range(d)[1] 9[1] 1# 求和,均值> sum(d),mean(d)[1] 25[1] 5# 加权平均> weighted.mean(d,rep(1,5)) [1] 5> weighted.mean(d,c(1,1,2,2,2)) [1] 5.75# 连乘> prod(1:5)[1] 120# 差分> diff(d)[1] 2 2 2 2# 秩> rank(d)[1] 1 2 3 4 5# 中位数> median(d)[1] 5# 分位数> quantile(d)0% 25% 50% 75% 100%1 3 5 7 9# 任意any,全体all> e<-seq(-3,3);e[1] -3 -2 -1 0 1 2 3> any(e<0);all(e<0)[1] TRUE[1] FALSE排列组合计算: 阶乘, 组合, 排列# 5!阶乘> factorial(5)# 组合, 从5个中选出2个> choose(5, 2)[1] 10# 列出从5个中选出2个的组合所有项> combn(5,2)[,1] [,2] [,3] [,4] [,5] [,6] [,7] [,8] [,9] [,10][1,] 1 1 1 1 2 2 2 3 3 4 [2,] 2 3 4 5 3 4 5 4 5 5# 计算0:10的组合个数> for (n in 0:10) print(choose(n, k = 0:n))[1] 1[1] 1 1[1] 1 2 1[1] 1 3 3 1[1] 1 4 6 4 1[1] 1 5 10 10 5 1[1] 1 6 15 20 15 6 1[1] 1 7 21 35 35 21 7 1[1] 1 8 28 56 70 56 28 8 1[1] 1 9 36 84 126 126 84 36 9 1[1] 1 10 45 120 210 252 210 120 45 10 1# 排列,从5个中选出2个> choose(5, 2)*factorial(2)[1] 20累积计算: 累加, 累乘, 最小累积, 最大累积# 累加> cumsum(1:5)[1] 1 3 6 10 15# 累乘> cumprod(1:5)[1] 1 2 6 24 120> e<-seq(-3,3);e[1] -3 -2 -1 0 1 2 3# 最小累积cummin> cummin(e)[1] -3 -3 -3 -3 -3 -3 -3# 最大累积cummax> cummax(e)[1] -3 -2 -1 0 1 2 3两个数组计算: 交集, 并集, 差集, 数组是否相等, 取唯一, 查匹配元素的索引, 找重复元素索引# 定义两个数组向量> x <- c(9:20, 1:5, 3:7, 0:8);x[1] 9 10 11 12 13 14 15 16 17 18 19 20 1 2 3 4 5[18] 3 4 5 6 7 0 1 2 3 4 5 6 7 8> y<- 1:10;y[1] 1 2 3 4 5 6 7 8 9 10# 交集> intersect(x,y)[1] 9 10 1 2 3 4 5 6 7 8# 并集> union(x,y)[1] 9 10 11 12 13 14 15 16 17 18 19 20 1 2 3 4 5[18] 6 7 0 8# 差集,从x中排除y> setdiff(x,y)[1] 11 12 13 14 15 16 17 18 19 20 0# 判断是否相等> setequal(x, y)[1] FALSE# 取唯一> unique(c(x,y))[1] 9 10 11 12 13 14 15 16 17 18 19 20 1 2 3 4 5[18] 6 7 0 8# 找到x在y中存在的元素的索引> which(x %in% y)[1] 1 2 13 14 15 16 17 18 19 20 21 22 24 25 26 27 28[18] 29 30 31> which(is.element(x,y))[1] 1 2 13 14 15 16 17 18 19 20 21 22 24 25 26 27 28[18] 29 30 31# 找到重复元素的索引> which(duplicated(x))[1] 18 19 20 24 25 26 27 28 29 302 三角函数计算2.1 三角函数在直角三角形中仅有锐角(大小在0到90度之间的角)三角函数的定义。
r语言基本语法
R语言是一种强大的统计分析和数据可视化语言。
它具有丰富的函数库,可以用来处理大量数据,并进行复杂的统计分析,成为当今研究人员的首选语言。
R语言的基本语法主要包括:
1. 变量:R中的变量可以是数值,字符串,向量,数组等。
2. 条件语句:R中使用if-else语句来检查条件是否满足,从而决定执行步骤。
3. 循环:R支持for和while循环,用于重复执行相同的步骤,直到特定条件不满足为止。
4. 函数:函数是R中最重要的部分,它可以帮助用户快速地访问数据、执行统计分析以及可视化数据等。
5. 运算符:R运算符提供了加减乘除,取余,逻辑运算等等的能力,可以用来处理数据。
r语言的基本操作
R语言是一种广泛应用于数据分析和统计建模的编程语言,它具有开源、免费、跨平台等优点。
在使用R语言进行数据分析时,需要掌握一些基本操作,包括:
1. 变量赋值:使用“<-”符号将数值、向量、矩阵等对象赋值给变量,如“x <- 10”,表示将数值10赋值给变量x。
2. 向量操作:使用c()函数创建向量,例如“x <- c(1, 2, 3)”表示创建一个包含1、2、3的向量x。
向量可以进行加减乘除等基本运算。
3. 矩阵操作:使用matrix()函数创建矩阵,例如“x <- matrix(1:6, nrow=2, ncol=3)”表示创建一个2行3列的矩阵,其中元素为1到6的数字。
4. 数据框操作:使用data.frame()函数创建数据框,例如“x <- data.frame(name=c('小明','小红'), age=c(18, 20))”表示创建一个包含姓名和年龄两列的数据框x。
5. 控制语句:包括if-else语句、for循环语句、while循环语句等,可以用来实现程序的逻辑控制和重复操作。
6. 函数定义:使用function()函数定义自己的函数,例如“myfun <- function(x) {return(x^2)}”表示定义了一个输入参数x,返回x的平方的函数myfun。
以上是R语言的基本操作,掌握这些操作可以方便进行数据处理和分析。
在实际应用中,还需要进一步学习R语言的高级操作和相关
包的使用,以完成更加复杂的数据分析任务。
r语言入门100道题以下是100个R语言入门的问题,供您参考:1. 如何在R中创建一个向量?2. 如何在R中创建一个矩阵?3. 如何在R中创建一个数据框?4. 如何在R中创建一个列表?5. 如何在R中创建一个因子?6. 如何在R中创建一个日期对象?7. 如何在R中读取一个CSV文件?8. 如何在R中写入一个CSV文件?9. 如何在R中读取一个Excel文件?10. 如何在R中写入一个Excel文件?11. 如何在R中读取一个文本文件?12. 如何在R中写入一个文本文件?13. 如何在R中计算一个向量的平均值?14. 如何在R中计算一个向量的标准差?15. 如何在R中计算一个向量的中位数?16. 如何在R中计算一个向量的最大值?17. 如何在R中计算一个向量的最小值?18. 如何在R中计算一个向量的总和?19. 如何在R中计算一个向量的排序列表?20. 如何在R中计算一个矩阵的行数和列数?21. 如何在R中计算一个矩阵的转置矩阵?22. 如何在R中计算一个矩阵的行列式?23. 如何在R中计算一个矩阵的逆矩阵?24. 如何在R中计算一个矩阵的特征值和特征向量?25. 如何在R中计算一个矩阵的行和列的总和?26. 如何在R中计算一个数据框的行数和列数?27. 如何在R中计算一个数据框的列的平均值?28. 如何在R中计算一个数据框的列的标准差?29. 如何在R中计算一个数据框的列的中位数?30. 如何在R中计算一个数据框的列的最大值?31. 如何在R中计算一个数据框的列的最小值?32. 如何在R中计算一个数据框的列的总和?33. 如何在R中从一个向量中选择指定的元素?34. 如何在R中从一个向量中删除指定的元素?35. 如何在R中从一个向量中查找指定的元素?36. 如何在R中从一个向量中替换指定的元素?37. 如何在R中从一个向量中添加元素?38. 如何在R中从一个向量中提取唯一的元素?39. 如何在R中从一个矩阵中选择指定的行和列?40. 如何在R中从一个矩阵中删除指定的行和列?41. 如何在R中从一个矩阵中查找指定的行和列?42. 如何在R中从一个矩阵中替换指定的行和列?43. 如何在R中从一个矩阵中添加行和列?44. 如何在R中从一个数据框中选择指定的行和列?45. 如何在R中从一个数据框中删除指定的行和列?46. 如何在R中从一个数据框中查找指定的行和列?47. 如何在R中从一个数据框中替换指定的行和列?48. 如何在R中从一个数据框中添加行和列?49. 如何在R中对一个向量进行排序?50. 如何在R中对一个矩阵的行和列进行排序?51. 如何在R中对一个数据框的列进行排序?52. 如何在R中对一个数据框的多个列进行排序?53. 如何在R中对一个向量进行分组求和?54. 如何在R中对一个数据框的列进行分组求和?55. 如何在R中对一个向量进行分组统计?56. 如何在R中对一个数据框的列进行分组统计?57. 如何在R中对一个向量进行条件筛选?58. 如何在R中对一个数据框的列进行条件筛选?59. 如何在R中对一个向量进行条件替换?60. 如何在R中对一个数据框的列进行条件替换?61. 如何在R中对一个数据框的列进行合并去重?62. 如何在R中对一个数据框的列进行合并求和?63. 如何在R中对一个数据框的列进行合并求平均值?64. 如何在R中计算一个向量的累计和?65. 如何在R中计算一个向量的累计乘积?66. 如何在R中计算一个向量的累计均值?67. 如何在R中计算一个矩阵的累计和?68. 如何在R中计算一个矩阵的累计乘积?69. 如何在R中计算一个矩阵的累计均值?70. 如何在R中计算一个数据框的累计和?71. 如何在R中计算一个数据框的累计乘积?72. 如何在R中计算一个数据框的累计均值?73. 如何在R中计算两个向量的点积?74. 如何在R中计算两个向量的叉积?75. 如何在R中计算两个向量的欧几里得距离?76. 如何在R中计算两个矩阵的乘积?77. 如何在R中计算两个矩阵的点积?78. 如何在R中计算两个矩阵的叉积?79. 如何在R中将一个向量转换为矩阵?80. 如何在R中将一个向量转换为数据框?81. 如何在R中将一个向量转换为列表?82. 如何在R中将一个向量转换为因子?83. 如何在R中将一个矩阵转换为向量?84. 如何在R中将一个矩阵转换为数据框?85. 如何在R中将一个矩阵转换为列表?86. 如何在R中将一个矩阵转换为因子?87. 如何在R中将一个数据框转换为向量?88. 如何在R中将一个数据框转换为矩阵?89. 如何在R中将一个数据框转换为列表?90. 如何在R中将一个数据框转换为因子?91. 如何在R中将一个列表转换为向量?92. 如何在R中将一个列表转换为矩阵?93. 如何在R中将一个列表转换为数据框?94. 如何在R中将一个列表转换为因子?95. 如何在R中将一个因子转换为向量?96. 如何在R中将一个因子转换为矩阵?97. 如何在R中将一个因子转换为数据框?98. 如何在R中将一个因子转换为列表?99. 如何在R中将一个日期对象转换为字符对象?100. 如何在R中将一个字符对象转换为日期对象?这些问题涵盖了R语言中一些基本操作的方方面面,希望对您入门R语言有所帮助。
⽣态学中R语⾔的应⽤(⼀)-R语⾔⼊门基础与常⽤技巧⽣态学中R语⾔的应⽤(⼀)--R语⾔⼊门基础与常⽤技巧作者:呆笨朝⼣⽬录1.1 R语⾔简介 (2)1.2 R语⾔的下载与安装 (2)1.3 Rstudio的安装与使⽤ (3)1.3.1 R Studio使⽤的⼩技巧 (4)1.4 R程序包(R Packages)简介 (5)1.4.1 程序包是什么? (5)1.4.2 为什么要安装程序包? (5)1.5 程序包的安装与导⼊ (5)1.5.1 程序包的安装 (5)1.5.2 程序包的加载 (6)1.6 如何获取帮助 (6)1.7 R语⾔的基本构成 (7)1.8 R语⾔使⽤技巧 (8)1.8.1 R语⾔使⽤过程中的⼀些操作技巧 (8)1.8.2 R语⾔编程中常见错误 (8)1.1 R语⾔简介R是⼀个⾃由、免费、源代码开放的软件,R语⾔主要⽤于数据处理、统计计算、分析绘图等⽅⾯。
⽬前R⽹站上有⼏千个包,并且在不断更新,包含经济计量、财经分析、⼈⽂科学研究以及⼈⼯智能等各个⽅⾯,R语⾔集数据分析与作图展现为⼀体,⼊门简单,资源开源共享,近年来使⽤发展迅速。
1.2 R语⾔的下载与安装直接⽹页搜索R,可以看到R的简介及下载页⾯,可以⾃⾏下载安装。
点击download R,根据提⽰在默认路径安装即可。
图1.1、⽹站页⾯图1.2、软件操作页⾯1.3 Rstudio的安装与使⽤R语⾔本⾝⾃带操作页⾯使⽤感较差,现⼤多使⽤R Studio配合使⽤R语⾔。
⽹页搜索R Studio,可以看到下载安装页⾯,同样根据提⽰安装即可。
这个是R Studio 的操作页⾯,⽐R语⾔看着舒服了很多,可以同时展现不同的版块,使⽤起来⽐较⽅便。
我的所有操作基本都是在R Studio上进⾏的。
1.3.1 R Studio使⽤的⼩技巧1、R语⾔版本更新在R Studio 中,可以使⽤ installr 包的 updateR() 更新R版本:installr::updateR()2、在R Studio中撤销上⼀步操作在R Studio中,每⼀步代码在“history”栏都有记录,如果不⼩⼼写完⼀系列代码(简称代码a系列),最后⼀步代码b出错或不是你想要的结果,那么,直接在history栏,只选定代码a系列--to console--按回车键,即可。
r语言实验报告标题:R语言在数据分析中的应用及指导意义导语:R语言作为一种广泛应用于数据分析与统计建模的编程语言,在各个领域中发挥着重要的作用。
本文将对R语言在数据分析中的应用进行探讨,并总结出相关的指导意义,希望能够为数据分析初学者提供一定的参考和帮助。
一、R语言的基础概述R语言是一种开源的编程语言,具备灵活、高效、优雅的特点,被广泛应用于数据科学和统计学领域。
R语言拥有丰富的数据处理、数据可视化和数据分析库,能够满足不同层次的数据分析需求。
二、R语言在数据预处理中的应用1.数据清洗:R语言提供了丰富的数据清洗函数和技术,可以对数据中的缺失值、异常值和重复值进行处理,提高数据的质量。
2.数据转换:R语言能够通过函数和技术,对数据进行转换和重构,实现数据格式的统一和规整,为后续的分析提供基础。
三、R语言在数据分析中的应用1.统计分析:R语言提供了众多的统计分析函数和包,能够进行常见的统计分析,如描述性统计、假设检验、方差分析等。
2.数据建模:R语言拥有强大的建模功能,可以进行线性回归、逻辑回归、决策树、聚类等建模分析,为数据科学家提供了广泛的选择。
3.机器学习:R语言支持各种机器学习算法,如朴素贝叶斯、支持向量机、随机森林等,可以进行模式识别、预测和分类等任务。
四、R语言在数据可视化中的应用1.基础绘图:R语言提供了各类绘图函数,如散点图、柱状图、线图等,能够直观地展示数据的分布和趋势。
2.高级可视化:通过使用R语言的各种包,如ggplot2、plotly 等,可以制作专业、美观的可视化图表,提升数据分析的表达力。
3.交互式可视化:R语言可以与Shiny等工具结合,实现交互式可视化,使用户能够灵活地探索数据,在分析过程中进行实时调整和观察。
五、R语言在数据分析中的指导意义1.灵活性:R语言的灵活性使得分析人员能够根据需求进行自由创造和探索,满足不同场景下的分析需求。
2.社区支持:R语言拥有庞大的社区,用户可以在社区中获取丰富的资源、经验和技术支持,提高分析效率。
代谢组学r语言入门-回复代谢组学是一门研究生物体内代谢产物的科学领域,通过对代谢产物的定量和分析,可以揭示生物体内代谢途径的变化和调节机制,进而深入了解生物体的生理和病理状态。
R语言作为一种强大的数据分析工具,被广泛应用于代谢组学领域。
本文将简要介绍代谢组学和R语言,并给出一些常用的R语言分析实例。
一、代谢组学概述代谢组学通过测量生物体内代谢产物的表达水平,可以全面了解代谢途径的变化和调节机制。
代谢产物可以是小分子有机物,如氨基酸、脂质、糖类等。
通过测量这些代谢产物在不同生理和病理状态下的变化,可以发现与特定疾病相关的代谢通路和生物标志物。
二、R语言介绍R语言是一种开源的、专门用于数据处理和统计分析的编程语言。
它提供了丰富的数据处理、可视化和统计分析函数库,让科学家可以方便地对代谢组学数据进行处理和分析。
1. 安装R和RStudio首先,我们需要在电脑上安装R语言和RStudio。
R语言可以从官方网站(2. R语言基础学习R语言的基础知识对于代谢组学分析是非常重要的。
R语言具有简洁而强大的语法,可以对数据进行各种操作和分析。
3. 导入数据在代谢组学研究中,我们通常需要从实验中获得原始数据,并将其导入R 语言进行分析。
R语言提供了多种导入数据的方法,如读取csv文件、Excel 文件、文本文件等。
导入数据后,我们可以使用R语言的函数进行数据预处理和清洗。
4. 数据可视化数据可视化是代谢组学分析的重要环节,通过图表展示分析结果可以更直观地理解数据。
R语言提供了多种绘图函数和图表库,如ggplot2和plotly,可以绘制各种类型的图表,如柱状图、散点图、箱线图等。
5. 统计分析代谢组学数据的统计分析是寻找差异代谢产物的重要步骤。
R语言提供了丰富的统计分析函数,如t检验、方差分析、线性回归等。
可以根据不同分析需求选择合适的函数进行统计分析。
6. 机器学习分析机器学习在代谢组学研究中扮演着重要的角色,可以通过构建模型来预测特定代谢产物的表达水平或者分类样本。

r语言数据类型及运算R语言是一种功能强大的统计分析语言,广泛应用于数据处理、数据可视化和机器学习等领域。
在R语言中,数据类型和运算是基础知识,掌握好这些内容对于编写高效的R代码至关重要。
本文将介绍R 语言的数据类型,包括数值型、字符型、逻辑型和因子型,以及常见的运算操作,包括算术运算、逻辑运算和向量化运算。
首先,我们来了解一下R语言中的数据类型。
在R语言中,最基本的数据类型是数值型(numeric),用于存储数值变量,例如:```x <- 10 # 定义一个数值型变量x,赋值为10```除了数值型,R语言还支持字符型(character)数据类型,用于存储文本变量,例如:```name <- "John" # 定义一个字符型变量name,赋值为"John"```另外,R语言还提供了逻辑型(logical)数据类型,用于存储逻辑值(TRUE或FALSE),例如:```is_student <- TRUE # 定义一个逻辑型变量is_student,赋值为TRUE```除了上述基本数据类型,R语言还提供了因子型(factor)数据类型,用于处理分类变量,例如:```gender <- factor(c("男", "女", "男", "女")) # 定义一个因子型变量gender,包含两个水平(男、女)```掌握好不同数据类型的使用,可以帮助我们更好地处理不同类型的数据。
接下来,我们将介绍R语言中的运算操作。
首先是算术运算,包括加法(+)、减法(-)、乘法(*)、除法(/)和取模(%%)等,例如:```x <- 5 + 3 # 加法运算,结果为8y <- 10 - 2 # 减法运算,结果为8z <- 4 * 2 # 乘法运算,结果为8w <- 16 / 2 # 除法运算,结果为8```除了基本的算术运算,R语言还提供了逻辑运算,包括与(&)、或(|)、非(!)和等于(==)等,例如:```a <- TRUE & FALSE # 与运算,结果为FALSEb <- TRUE | FALSE # 或运算,结果为TRUEc <- !TRUE # 非运算,结果为FALSEd <- 5 == 5 # 等于运算,结果为TRUE```最后,我们还需要了解R语言中的向量化运算。
《R语言编程基础》教学大纲
课程名称:R语言编程基础
课程类别:必修
适用专业:大数据技术类相关专业
总学时:48学时(其中理论18学时,实验30学时)
总学分:3.0学分
一、课程的性质
大数据时代已经到来,在商业、经济及其他领域中基于数据和分析去发现问题并做出科学、客观的决策越来越重要。
数据分析技术将帮助企业用户在合理时间内获取、管理、处理以及整理海量数据,为企业经营决策提供积极的帮助。
数据分析作为一门前沿技术,广泛应用于物联网、云计算、移动互联网等战略新兴产业,有实践经验的数据分析人才已经成为了各企业争夺的热门。
为了推动我国大数据,云计算,人工智能行业的发展,满足日益增长的数据分析人才需求,特开设R语言编程基础课程。
二、课程的任务
通过本课程的学习,使学生认识R的编译环境,获取与安装R语言,使用R包,控制流、文件读取、数据可视化及使用可视化工具Rattle进行数据分析等基本操作。
本课程将紧密结合示例操作,及时讲解基础知识、相关函数及可视化操作,为学生今后进行实际编程操作奠定基础,为数据分析可视化提供方法,同时,掌握Rattle工具能更方便的实现数据挖掘相关操作。
三、课程学时分配
四、教学内容及学时安排
1.理论教学
2.实验教学
五、考核方式
突出学生解决实际问题的能力,加强过程性考核。
课程考核的成绩构成= 学习态度(10%)+课堂参与(20%)+期末考核(70%),期末考试建议采用开卷形式,试题应包括基本概念、绘图、分组聚合、数据合并、数据清洗、数据变换、模型构建等部分,题型可采用判断题、选择、简答、应用题等方式。
R语言初步1第一节基本知识一、界面介绍R语言是一种自由软件编程语言与操作环境,主要用于统计分析、绘图、数据挖掘。
R 语言最早由新西兰奥克兰大学的Ross Ihaka和Robert Gentleman开发,所以命名为R语言。
R语言是免费下载的,可以在网站Http:\\/中找到适合自己的镜像网站,下载R语言安装包和其他文件。
R的界面大致如下图所示,包括菜单、快捷键、命令窗口和图形输出窗口。
R主要通过在命令窗口中输入命令来进行操作,菜单能够提供的功能很少,因此学习R 需要记住一些常用的命令,更多的命令则需要常备一份命令手册,以便查询。
R的命令窗口中有一个红色的“>”符号,操作命令即写在这个符号的后面,完成一条命令后,用回车结束。
用getwd()可以知道R的工作路径,也就是操作过程中的数据、文件等所存储的目录。
一般默认的目录为用户的Document目录。
为了避免大量的文件混淆,可以专门为R的操作设定一个工作目录。
假定在C盘上建立一个名叫“R”的目录,用以下命令进行设定:setwd("c:\\R"),如图:在这里注意一下,当引用一个路径时,R中需要用到双斜线来表示路径引用,如上文中的c:\\R,这是R的一个特殊情况。
再比如以下操作:1参考薛毅,陈立萍(2014):R语言实用教程,清华大学出版社>x1<-c(10,12,14,16,18)>y1<-c(2.5,2.6,3.1,4.6,3.8)>plot(x1,y1)注意几点:(1)式子中的“<-”表示赋值,也就是把右边的数值赋予左边的变量名。
(2)R语言中对于字母的大小写非常敏感,变量名可以用大写也可以用小写,但用大写字母命名的变量如果改用小写来调用,会无法识别。
(3)如果觉得命令窗口上的内容太多,可以用Ctrl-L来清屏幕。
(4)如果要重新调用此前用过的命令,可以用上箭头回溯此前的命令,也可以用history()来查看历史记录。
R 语言是一种广泛应用于统计学和数据科学领域的编程语言。
对于新手来说,学习R 语言可能会面临一些挑战。
我们将讨论一些学习 R 语言的注意事项,帮助新手更快地掌握这门语言。
1.理解基础概念在学习 R 语言之前,新手需要理解一些基础概念。
例如,他们需要了解向量、矩阵、列表、数据框等数据结构,以及函数、循环、条件语句等编程概念。
他们还需要了解 R 语言中的数据类型和变量类型,例如字符型、数值型、逻辑型等。
只有理解了这些基础概念,新手才能更好地理解 R 语言的工作原理。
2.学习基础语法学习 R 语言需要掌握一些基础语法。
例如,新手需要了解如何定义变量、如何进行算术运算、如何使用赋值语句、如何使用条件语句等。
他们还需要了解如何使用函数和向量化操作,以及如何进行数据的读取和输出等。
掌握了这些基础语法,新手才能更好地编写R 语言代码。
3.阅读官方文档R 语言有丰富的官方文档,新手应该花时间阅读这些文档。
官方文档提供了关于 R 语言的详细信息,包括函数的用法、数据结构的定义、变量类型的说明等。
官方文档还提供了许多实例和代码片段,帮助新手更好地理解 R 语言的用法。
4.参考在线资源除了官方文档之外,新手还可以参考在线资源,例如 R 语言的论坛、博客、教程等。
这些资源提供了许多实用的技巧和技术,帮助新手更好地掌握 R 语言。
这些资源还提供了许多实例和代码片段,帮助新手更好地理解 R 语言的用法。
5.练习编写代码学习 R 语言需要不断地练习编写代码。
新手可以从简单的代码开始,逐渐增加难度。
通过编写代码,新手可以更好地理解 R 语言的用法,并且可以提高自己的编程能力。
6.了解常见问题学习 R 语言过程中,新手可能会遇到一些常见问题。
例如,代码无法运行、函数无法使用、数据无法读取等。
在遇到这些问题时,新手可以通过查阅官方文档、参考在线资源、向论坛提问等方式解决问题。
了解这些常见问题,可以帮助新手更好地应对各种挑战。
学习 R 语言需要理解基础概念、学习基础语法、阅读官方文档、参考在线资源、练习编写代码、了解常见问题等。
1. R语言是什么?
R语言是一种用于统计分析和数据可视化的编程语言,它广泛应用于数据挖掘、机器学习、生物信息学等领域。
2. R语言的特点有哪些?
R语言具有以下特点:
- 免费开源;
- 功能强大,支持多种统计分析方法;
- 丰富的数据处理和可视化工具;
- 支持并行计算和分布式计算;
- 社区活跃,有大量的扩展包可供使用。
3. R语言的数据类型有哪些?
R语言的主要数据类型包括:数值型(numeric)、字符型(character)、因子型(factor)、逻辑型(logical)、复数型(complex)等。
4. R语言的基本语法规则有哪些?
R语言的基本语法规则包括:
- 使用#号表示注释;
- 使用双引号或单引号表示字符串;
- 使用$符号访问对象的属性和方法;
- 使用<-符号进行赋值操作;
- 使用cat()函数输出文本,使用print()函数输出变量值;
- 使用ifelse()、switch()等函数进行条件判断;
- 使用for循环、while循环等结构进行循环操作。
二、R1.下载安装/2.运行环境:英文状态,以函数形式运行3.向量(1)输入①> x <- c(1,3,2,5)> x[1] 1 3 2 5②>x = c(1,6,2)> x[1] 1 6 2③>x = c(1:10) >x = 1:10④>x = seq(1,10) >x = seq(-2*pi,2*pi,length=50)> y = c(1,4,3)(2)长度> length (x)[1] 3> length (y)[1] 3(3)运算x,y的长度一样,可以进行运算。
例如x+y,x-y,x*y,x/y,这些运算是分元素进行的。
(4)显示和清除变量> ls() %显示变量[1] "x" "y" %清除变量x,y> rm(x,y)> ls()character (0)> rm(list=ls()) %清除所有变量(5)保留小数位数①>x=round(x,3)②>sprintf(“%.10f”,0.25)4.矩阵(1)寻求帮助>help(matrix) 或>?matrix(2)输入①> x=matrix (data=c(1,2,3,4) , nrow=2, ncol =2)> x[,1] [,2][1,] 1 3[2,] 2 4②> x=matrix (c(1,2,3,4) ,2,2)③> matrix (c(1,2,3,4) ,2,2,byrow =TRUE)[,1] [,2][1,] 1 2[2,] 3 4④产生随机矩阵:> x=rnom(%填行列数)扩展1:1-9按行、列排成3行3列的矩阵。
>x=matrix (data=c(1,2,3,4,5,6,7,8,9) , nrow=3, ncol=3,byrow=TURE)> x[,1] [,2] [,3][1,] 1 2 3[2,] 4 5 6[3,] 7 8 9>x=matrix (data=c(1,2,3,4,5,6,7,8,9) , nrow=3, ncol=3) %> x[,1] [,2] [,3][1,] 1 4 7[2,] 2 5 8[3,] 3 6 9扩展2:99个1按行排成3行33列的矩阵。
>y=matrix (data=c(1) , nrow=3, ncol=3,byrow=TURE)(3)矩阵的运算x,y的行、列都一样,可以进行运算。
例如x+y,x-y,x*y,x/y,这些运算是分元素进行的。
高代中矩阵的乘法:x%*%y高代中矩阵的除法:x%*%solve(y)(4)元素的提取> A=matrix (1:16 ,4 ,4)> A[,1] [,2] [,3] [,4][1,] 1 5 9 13[2,] 2 6 10 14[3,] 3 7 11 15[4,] 4 8 12 16①> A[2,3][1] 10②> A[c(1,3) ,c(2,4) ][,1] [,2][1,] 5 13[2,] 7 15③> A[1:3 ,2:4][,1] [,2] [,3][1,] 5 9 13[2,] 6 10 14[3,] 7 11 15④> A[1:2 ,][,1] [,2] [,3] [,4] [1,] 1 5 9 13 [2,] 2 6 10 14 > A[ ,1:2] [,1] [,2] [1,] 1 5 [2,] 2 6 [3,] 3 7 [4,] 4 8 > A[1,][1] 1 5 9 13⑤> A[-c(1,3) ,][,1] [,2] [,3] [,4] [1,] 2 6 10 14 [2,] 4 8 12 16 > A[-c(1,3) ,-c(1,3,4)] [1] 6 8 ⑥> dim(A) [1] 4 45.绘图(1)散点图> x=rnorm(100) > y=rnorm(100) > plot(x,y)> plot(x,y,xlab=" this is the x-axis",ylab=" this is the y-axis", main=" Plot of X vs Y")-2-1012-2-1012x y-2-112-2-1012Plot of X vs Ythis is the x-axist h i s i s t h e y -a x i s(2)保存图片①pdf 类型 > pdf ("Figure.pdf") > plot(x,y,col ="green") > dev.off()null device 1②jpeg 类型> jpeg("Figure.jpeg")(3)等高线图 > y=x> f=outer(x,y,function(x,y)cos(y)/(1+x^2)) > contour(x,y,f) %下面第一幅图> contour(x,y,f,nlevels=45,add=T) %下面第二幅图 > fa=(f-t(f))/2> contour(x,y,fa,nlevels=15) %下面第三幅图 > image(x,y,fa) %下面第四幅图-0.8-0.8-0.4-0.4 -0.2-0.20.20.40.60.8-3-2-10123-3-10123-0.8-0.8-0.4 -0.4 -0.2 -0.20 0 0.2 0.4 0.6 0.8-3-2-10123-3-10123-0.9-0.9 -0.85 -0.85 -0.6 -0.6 -0.5-0.5-0.4-0.4-0.25 -0.25-0.2 -0.2-0.1 -0.1 -0.05 -0.050.050.050.10.15 0.20.250.350.4 0.45 0.50.60.7.8-0.4 -0.4-0.3-0.3-0.2-0.2-0.1-0.1 00 00.1 0.10.20.2 0.30.30.4 0.4-3-2-10123-3-10123-3-2-10123-3-2-1123xy(4)轮廓图> persp(x,y,fa) %下面第一幅图> persp(x,y,fa ,theta =30) %下面第二幅图> persp(x,y,fa ,theta =30, phi =20) %下面第三幅图 > persp(x,y,fa ,theta =30, phi =70) %下面第四幅图xyf axyf axyf axyf a扩展1.在同一图中画出正弦与余弦曲线 ①x=seq(-2*pi,2*pi,length=40) y=sin(x)plot(x,y,xlim=c(-2*pi,2*pi),ylim=c(-1,1),col="red",lty=1,xlab="角 度",ylab="数值",main="正弦余弦曲线") y=cos(x)lines(x,y,col="blue",lty=2)legend("topleft",inset=.05,c("sin","cos"),lty=c(1,2),col=c("red","blue")) ②x=seq(-2*pi,2*pi,length=40) y=sin(x)plot(x,y,xlim=c(-2*pi,2*pi),ylim=c(-1,1),col="red",type="l",xlab="角度 ",ylab="数值",main="正弦余弦曲线") y=cos(x)lines(x,y,col="blue",lty=2)legend("topleft",inset=.05,c("sin","cos"),lty=c(1,2),col=c("red","blue") )-6-4-20246-1.0-0.50.00.51.0正弦余弦曲线角度数值sin cos-6-4-20246-1.0-0.50.00.51.0正弦余弦曲线角度数值sin cos① 的结果 ②的结果 注:type= "p " 在图形中数据显示为点 type= "l " 在图形中数据显示为线type= "b " 在图形中数据显示为点和连接线 type= "o " 在图形中数据点覆盖在线上type= "h " 在图形中数据显示为从点到x 轴的垂直线 type= "s " 在图形中数据显示为阶梯图 type= "n " 在图形中数据不显示拓展2.画马鞍面,并从不同视角观察。
x=seq(-5,5,length=50) y=xz=outer(x,y,function (x,y)x*y) persp(x,y,z)persp(x,y,z,theta=30) persp(x,y,z,theta=50)persp(x,y,z,theta=30,phi=20) persp(x,y,z,theta=30,phi=70) persp(x,y,z,theta=30,phi=40)6.数据的输入、观察 (1)数据的输入Auto=read.csv("Auto.csv")注:把Excel 文件保存成.csv 格式,并放在运行路径下,在运行上面命令加载数据。
(2)数据的观察 fix(Auto)(3)删除无数据的行 Auto=na.omit(Auto)(4)查看数据的变量 > names(Auto)[1] "mpg" "cylinders" "displacement" "horsepower" [5] "weight" "acceleration" "year" "origin" [9] "name"(5)plot(cylinders,mpg)错误。