7.0 References
- 格式:pdf
- 大小:46.32 KB
- 文档页数:16

认证之家 EUROPEAN STANDARDEN 55022 NORME EUROPÉENNEEUROPÄISCHE NORM September 2006CENELECEuropean Committee for Electrotechnical StandardizationComité Européen de Normalisation ElectrotechniqueEuropäisches Komitee für Elektrotechnische NormungCentral Secretariat: rue de Stassart 35, B - 1050 Brussels© 2006 CENELEC - All rights of exploitation in any form and by any means reserved worldwide for CENELEC members.Ref. No. EN 55022:2006 E ICS 33.100.10Supersedes EN 55022:1998 + A1:2000 + A2:2003English versionInformation technology equipment -Radio disturbance characteristics -Limits and methods of measurement(CISPR 22:2005, modified)Appareils de traitement de l'information - Caractéristiques des perturbationsradioélectriques -Limites et méthodes de mesure(CISPR 22:2005, modifiée)Einrichtungen der Informationstechnik - Funkstöreigenschaften - Grenzwerte und Messverfahren (CISPR 22:2005, modifiziert)This European Standard was approved by CENELEC on 2005-09-13. CENELEC members are bound to comply with the CEN/CENELEC Internal Regulations which stipulate the conditions for giving this European Standard the status of a national standard without any alteration.Up-to-date lists and bibliographical references concerning such national standards may be obtained on application to the Central Secretariat or to any CENELEC member.This European Standard exists in three official versions (English, French, German). A version in any other language made by translation under the responsibility of a CENELEC member into its own language and notified to the Central Secretariat has the same status as the official versions.CENELEC members are the national electrotechnical committees of Austria, Belgium, Cyprus, the Czech Republic, Denmark, Estonia, Finland, France, Germany, Greece, Hungary, Iceland, Ireland, Italy, Latvia, Lithuania, Luxembourg, Malta, the Netherlands, Norway, Poland, Portugal, Romania, Slovakia, Slovenia, Spain, Sweden, Switzerland and the United Kingdom.EN 55022:2006– 2 –ForewordThe text of the International Standard CISPR 22:2003 as well as A1:2004 and CISPR/I/136/FDIS (Amendment 3) and CISPR/I/128/CDV (Amendment 2, fragment 17), prepared by CISPR SC I "Electromagnetic compatibility of information technology equipment, multimedia equipment and receivers", together with the common modifications prepared by the Technical Committee CENELEC TC 210, Electromagnetic compatibility (EMC), was submitted to the CENELEC Unique Acceptance Procedure for acceptance as a European Standard.In addition, the text of CISPR/I/135A/FDIS (future A2, fragment 1) to CISPR 22:2003, also prepared by CISPR SC I "Electromagnetic compatibility of information technology equipment, multimedia equipment and receivers", was submitted to the CENELEC formal vote as prAD to prEN 55022:2005, with the intention of the two documents being merged and ratified together as a new edition of EN 55022.During the period of voting on these CENELEC drafts, the amendments CISPR/I/135A/FDIS and CISPR/I/136/FDIS (Amendments 2 and 3 respectively) made to CISPR 22:2003, resulted in the publication of a new (fifth) edition of CISPR 22, in accordance with IEC rules. The resulting CISPR 22:2005 was published in April 2005.This resulting version of EN 55022, which was ratified on 2005-09-13, is therefore identical to CISPR 22:2005 except for the common modifications that were included in the document submitted to the CENELEC Unique Acceptance Procedure. The common modifications include CISPR/I/128/CDV, as this draft was not implemented in the unamended CISPR 22:2005.This European Standard supersedes EN 55022:1998 and its amendments A1:2000 and A2:2003.The following dates were fixed:–latest date by which the EN has to be implementedat national level by publication of an identicalnational standard or by endorsement (dop) 2007-04-01–latest date by which the national standards conflictingwith the EN have to be withdrawn (dow) 2009-10-01This European Standard has been prepared under a mandate given to CENELEC by the European Commission and the European Free Trade Association and covers essential requirements of EC Directives 89/336/EEC, 2004/108/EC and 1999/5/EC. See Annex ZZ.__________– 3 – EN 55022:2006CONTENTS INTRODUCTION (6)1Scope and object (7)2Normative references (7)3Definitions (8)4Classification of ITE (9)4.1Class B ITE (9)4.2Class A ITE (10)5Limits for conducted disturbance at mains terminals and telecommunication ports (10)5.1Limits of mains terminal disturbance voltage (10)5.2Limits of conducted common mode (asymmetric mode) disturbanceat telecommunication ports (11)6Limits for radiated disturbance (11)7Interpretation of CISPR radio disturbance limit (12)7.1Significance of a CISPR limit (12)7.2Application of limits in tests for conformity of equipment in series production (12)8General measurement conditions (13)8.1Ambient noise (13)8.2General arrangement (14)8.3EUT arrangement (16)8.4Operation of the EUT (18)8.5Operation of multifunction equipment (19)9Method of measurement of conducted disturbance at mains terminals and telecommunication ports (20)9.1Measurement detectors (20)9.2Measuring receivers (20)9.3Artificial mains network (AMN) (20)9.4Ground reference plane (21)9.5EUT arrangement (21)9.6Measurement of disturbances at telecommunication ports (23)9.7Recording of measurements (27)10Method of measurement of radiated disturbance (27)10.1Measurement detectors (27)10.2Measuring receivers (27)10.3Antenna (27)10.4Measurement site (28)10.5EUT arrangement (29)10.6Recording of measurements (29)10.7Measurement in the presence of high ambient signals (30)10.8User installation testing (30)11Measurement uncertainty (30)EN 55022:2006– 4 –Annex A (normative) Site attenuation measurements of alternative test sites (41)Annex B (normative) Decision tree for peak detector measurements (47)Annex C (normative) Possible test set-ups for common mode measurements (48)Annex D (informative) Schematic diagrams of examples of impedance stabilization networks (ISN) (55)Annex E (informative) Parameters of signals at telecommunication ports (64)Annex F (informative) Rationale for disturbance measurements and methods (67)Annex ZA (normative) Normative references to international publications with their corresponding European publications (75)Annex ZZ (informative) Coverage of Essential Requirements of EC Directives (76)Bibliography (74)Figure 1 – Test site (31)Figure 2 – Minimum alternative measurement site (32)Figure 3 – Minimum size of metal ground plane (32)Figure 4 – Example test arrangement for tabletop equipment (conducted and radiated emissions) (plan view) (33)Figure 5 – Example test arrangement for tabletop equipment (conducted emission measurement – alternative 1a) (34)Figure 6 – Example test arrangement for tabletop equipment (conducted emission measurement – alternative 1b) (34)Figure 7 – Example test arrangement for tabletop equipment (conducted emission measurement – alternative 2) (35)Figure 8 – Example test arrangement for floor-standing equipment (conductedemission measurement) (36)Figure 9 – Example test arrangement for combinations of equipment (conductedemission measurement) (37)Figure 10 – Example test arrangement for tabletop equipment (radiated emission measurement) (37)Figure 11 – Example test arrangement for floor-standing equipment (radiated emission measurement) (38)Figure 12 – Example test arrangement for floor-standing equipment with vertical riserand overhead cables (radiated and conducted emission measurement) (39)Figure 13 – Example test arrangement for combinations of equipment (radiatedemission measurement) (40)Figure A.1 – Typical antenna positions for alternate site NSA measurements (44)Figure A.2 – Antenna positions for alternate site measurements for minimumrecommended volume (45)Figure B.1 – Decision tree for peak detector measurements (47)Figure C.1 – Using CDNs described in IEC 61000-4-6 as CDN/ISNs (49)Figure C.2 – Using a 150 Ω load to the outside surface of the shield ("in situCDN/ISN") (50)Figure C.3 – Using a combination of current probe and capacitive voltage probe (50)Figure C.4 – Using no shield connection to ground and no ISN (51)Figure C.5 – Calibration fixture (53)Figure C.6 – Flowchart for selecting test method (54)Figure D.1 − ISN for use with unscreened single balanced pairs (55)– 5 – EN 55022:2006 Figure D.2 − ISN with high longitudinal conversion loss (LCL) for use with either oneor two unscreened balanced pairs (56)Figure D.3 − ISN with high longitudinal conversion loss (LCL) for use with one, two,three, or four unscreened balanced pairs (57)Figure D.4 − ISN, including a 50 Ω source matching network at the voltage measuringport, for use with two unscreened balanced pairs (58)Figure D.5 − ISN for use with two unscreened balanced pairs (59)Figure D.6 − ISN, including a 50 Ω source matching network at the voltage measuringport, for use with four unscreened balanced pairs (60)Figure D.7 − ISN for use with four unscreened balanced pairs (61)Figure D.8 − ISN for use with coaxial cables, employing an internal common modechoke created by bifilar winding an insulated centre-conductor wire and an insulatedscreen-conductor wire on a common magnetic core (for example, a ferrite toroid) (61)Figure D.9 − ISN for use with coaxial cables, employing an internal common modechoke created by miniature coaxial cable (miniature semi-rigid solid copper screen or miniature double-braided screen coaxial cable) wound on ferrite toroids (62)Figure D.10 − ISN for use with multi-conductor screened cables, employing an internal common mode choke created by bifilar winding multiple insulated signal wires and an insulated screen-conductor wire on a common magnetic core (for example, a ferrite toroid) (62)Figure D.11 − ISN for use with multi-conductor screened cables, employing an internal common mode choke created by winding a multi-conductor screened cable on ferrite toroids (63)Figure F.1 – Basic circuit for considering the limits with defined TCM impedance of 150 Ω..70 Figure F.2 – Basic circuit for the measurement with unknown TCM impedance (70)Figure F.3 – Impedance layout of the components used in Figure C.2 (72)Figure F.4 – Basic test set-up to measure combined impedance of the 150 Ω and ferrites (73)Table 1 – Limits for conducted disturbance at the mains ports of class A ITE (10)Table 2 – Limits for conducted disturbance at the mains ports of class B ITE (11)Table 3 – Limits of conducted common mode (asymmetric mode) disturbanceat telecommunication ports in the frequency range 0,15 MHz to 30 MHz for class A equipment (11)Table 4 – Limits of conducted common mode (asymmetric mode) disturbance at telecommunication ports in the frequency range 0,15 MHz to 30 MHz for class B equipment (11)Table 5 – Limits for radiated disturbance of class A ITE at a measuring distance of10 m (12)Table 6 – Limits for radiated disturbance of class B ITE at a measuring distance of10 m (12)Table 7 – Acronyms used in figures (31)Table A.1 – Normalized site attenuation (A N (dB)) for recommended geometries with broadband antennas (43)Table F.1 – Summary of advantages and disadvantages of the methods described inAnnex C (68)EN 55022:2006– 6 –INTRODUCTIONThe scope is extended to the whole radio-frequency range from 9 kHz to 400 GHz, but limits are formulated only in restricted frequency bands, which is considered sufficient to reach adequate emission levels to protect radio broadcast and telecommunication services, and to allow other apparatus to operate as intended at reasonable distance.– 7 – EN 55022:2006 INFORMATION TECHNOLOGY EQUIPMENT –RADIO DISTURBANCE CHARACTERISTICS –LIMITS AND METHODS OF MEASUREMENT1 Scope and objectThis International Standard applies to ITE as defined in 3.1.Procedures are given for the measurement of the levels of spurious signals generated by the ITE and limits are specified for the frequency range 9 kHz to 400 GHz for both class A and class B equipment. No measurements need be performed at frequencies where no limits are specified.The intention of this publication is to establish uniform requirements for the radio disturbance level of the equipment contained in the scope, to fix limits of disturbance, to describe methods of measurement and to standardize operating conditions and interpretation of results.2 Normative referencesThe following referenced documents are indispensable for the application of this document. For dated references, only the edition cited applies. For undated references, the latest edition of the referenced document (including any amendments) applies.IEC 60083:1997, Plugs and socket-outlets for domestic and similar general use standardized in member countries of IECIEC 61000-4-6:2003, Electromagnetic compatibility (EMC) – Part 4-6: Testing and measurement techniques – Immunity to conducted disturbances, induced by radio-frequency fieldsCISPR 11:2003, Industrial, scientific, and medical (ISM) radio-frequency equipment – Electro-magnetic disturbance characteristics – Limits and methods of measurementCISPR 13:2001, Sound and television broadcast receivers and associated equipment – Radio disturbance characteristics – Limits and methods of measurementCISPR 16-1-1:2003, Specification for radio disturbance and immunity measuring apparatus and methods – Part 1-1: Radio disturbance and immunity measuring apparatus – Measuring apparatusCISPR 16-1-2:2003, Specification for radio disturbance and immunity measuring apparatus and methods – Part 1-2: Radio disturbance and immunity measuring apparatus – Ancillary equipment – Conducted disturbances 1Amendment 1 (2004)___________1There exists a consolidated edition 1.1 (2004) including edition 1.0 and its Amendment 1.EN 55022:2006– 8 –CISPR 16-1-4:2004, Specification for radio disturbance and immunity measuring apparatus and methods – Part 1-4: Radio disturbance and immunity measuring apparatus – Ancillary equipment – Radiated disturbancesCISPR 16-4-2:2003, Specification for radio disturbance and immunity measuring apparatus and methods – Part 4-2: Uncertainties, statistics and limit modelling – Uncertainty in EMC measurements3 DefinitionsFor the purposes of this document the following definitions apply:3.1information technology equipment (ITE)any equipment:a) which has a primary function of either (or a combination of) entry, storage, display,retrieval, transmission, processing, switching, or control, of data and of telecommuni-cation messages and which may be equipped with one or more terminal ports typically operated for information transfer;b) with a rated supply voltage not exceeding 600 V.It includes, for example, data processing equipment, office machines, electronic business equipment and telecommunication equipment.Any equipment (or part of the ITE equipment) which has a primary function of radio trans-mission and/or reception according to the ITU Radio Regulations are excluded from the scope of this publication.NOTE Any equipment which has a function of radio transmission and/or reception according to the definitions of the ITU Radio Regulations should fulfil the national radio regulations, whether or not this publication is also valid. Equipment, for which all disturbance requirements in the frequency range are explicitly formulated in other IEC or CISPR publications, are excluded from the scope of this publication.3.2equipment under test (EUT)representative ITE or functionally interactive group of ITE (system) which includes one or more host unit(s) and is used for evaluation purposes3.3host unitpart of an ITE system or unit that provides the mechanical housing for modules, which may contain radio-frequency sources, and may provide power distribution to other ITE. Power distribution may be a.c., d.c., or both between the host unit(s) and modules or other ITE3.4modulepart of an ITE which provides a function and may contain radio-frequency sources3.5identical modules and ITEmodules and ITE produced in quantity and within normal manufacturing tolerances to a given manufacturing specification– 9 – EN 55022:20063.6telecommunications/network portpoint of connection for voice, data and signalling transfers intended to interconnect widely-dispersed systems via such means as direct connection to multi-user telecommunications networks (e.g. public switched telecommunications networks (PSTN) integrated services digital networks (ISDN), x-type digital subscriber lines (xDSL), etc.), local area networks (e.g. Ethernet, Token Ring, etc.) and similar networksNOTE A port generally intended for interconnection of components of an ITE system under test (e.g. RS-232, IEEE Standard 1284 (parallel printer), Universal Serial Bus (USB), IEEE Standard 1394 (“Fire Wire”), etc.) and used in accordance with its functional specifications (e.g. for the maximum length of cable connected to it), is not considered to be a telecommunications/network port under this definition.3.7multifunction equipmentinformation technology equipment in which two or more functions subject to this standard and/or to other standards are provided in the same unitNOTE Examples of information technology equipment include–a personal computer provided with a telecommunication function and/or broadcast reception function; – a personal computer provided with a measuring function, etc.3.8total common mode impedanceTCM impedanceimpedance between the cable attached to the EUT port under test and the reference ground planeNOTE The complete cable is seen as one wire of the circuit, the ground plane as the other wire of the circuit. The TCM wave is the transmission mode of electrical energy, which can lead to radiation of electrical energy if the cable is exposed in the real application. Vice versa, this is also the dominant mode, which results from exposition of the cable to external electromagnetic fields.3.9arrangementphysical layout of the EUT that includes connected peripherals/associated equipment within the test area3.10configurationmode of operation and other operational conditions of the EUT3.11associated equipmentAEequipment needed to maintain the data traffic on the cable attached to the EUT port under test and (or) to maintain the normal operation of the EUT during the test. The associated equipment may be physically located outside the test areaNOTE The AE can be another ITE, a traffic simulator or a connection to a network. The AE can be situated close to the measurement set-up, outside the measurement room or be represented by the connection to a network. AE should not have any appreciable influence on the test results.4 Classification of ITE4.1 Class B ITEClass B ITE is a category of apparatus which satisfies the class B ITE disturbance limits. ITE is subdivided into two categories denoted class A ITE and class B ITE.EN 55022:2006 – 10 – Class B ITE is intended primarily for use in the domestic environment and may include:– equipment with no fixed place of use; for example, portable equipment powered by built-inbatteries;– telecommunication terminal equipment powered by a telecommunication network; – personal computers and auxiliary connected equipment.NOTE The domestic environment is an environment where the use of broadcast radio and television receivers may be expected within a distance of 10 m of the apparatus concerned.4.2 Class A ITE WarningThis is a class A product. In a domestic environment this product may cause radio inter-ference in which case the user may be required to take adequate measures.5 Limits for conducted disturbance at mains terminalsand telecommunication portsThe equipment under test (EUT) shall meet the limits in Tables 1 and 3 or 2 and 4, as appli-cable, including the average limit and the quasi-peak limit when using, respectively, an average detector receiver and quasi-peak detector receiver and measured in accordance with the methods described in Clause 9. Either the voltage limits or the current limits in Table 3 or 4, as applicable, shall be met except for the measurement method of C.1.3 where both limits shall be met. If the average limit is met when using a quasi-peak detector receiver, the EUT shall be deemed to meet both limits and measurement with the average detector receiver is unnecessary.If the reading of the measuring receiver shows fluctuations close to the limit, the reading shall be observed for at least 15 s at each measurement frequency; the higher reading shall be recorded with the exception of any brief isolated high reading which shall be ignored.5.1 Limits of mains terminal disturbance voltageTable 1 – Limits for conducted disturbance at the mains portsof class A ITE Limits dB(μV) Frequency rangeMHzQuasi-peak Average 0,15 to 0,5079 66 0,50 to 30 73 60NOTE The lower limit shall apply at the transition frequency.Class A ITE is a category of all other ITE which satisfies the class A ITE limits but not the class B ITE limits. The following warning shall be included in the instructions for use:Table 2 – Limits for conducted disturbance at the mains portsof class B ITE Limits dB(μV) Frequency rangeMHzQuasi-peak Average 0,15 to 0,5066 to 56 56 to 46 0,50 to 556 46 5 to 30 60 50NOTE 1 The lower limit shall apply at the transition frequencies.NOTE 2 The limit decreases linearly with the logarithm of the frequency in therange 0,15 MHz to 0,50 MHz.5.2 Limits of conducted common mode (asymmetric mode) disturbanceat telecommunication ports 2)Table 3 – Limits of conducted common mode (asymmetric mode) disturbanceat telecommunication ports in the frequency range 0,15 MHz to 30 MHzfor class A equipment Voltage limits dB (μV) Current limits dB (μA) Frequency rangeMHzQuasi-peak Average Quasi-peak Average0,15 to 0,597 to 87 84 to 74 53 to 43 40 to 30 0,5 to 30 87 74 43 30 NOTE 1 The limits decrease linearly with the logarithm of the frequency in the range 0,15 MHz to 0,5 MHz.NOTE 2 The current and voltage disturbance limits are derived for use with an impedance stabilization network (ISN) which presents a common mode (asymmetric mode) impedance of 150 Ω to the telecommunication port under test (conversion factor is 20 log 10 150 / I = 44 dB).Table 4 – Limits of conducted common mode (asymmetric mode) disturbanceat telecommunication ports in the frequency range 0,15 MHz to 30 MHzfor class B equipment Voltage limits dB(μV) Current limits dB(μA) Frequency rangeMHzQuasi-peak Average Quasi-peakAverage 0,15 to 0,584 to 74 74 to 64 40 to 30 30 to 20 0,5 to 30 74 64 30 20 NOTE 1 The limits decrease linearly with the logarithm of the frequency in the range 0,15 MHz to 0,5 MHz.NOTE 2 The current and voltage disturbance limits are derived for use with an impedance stabilization network (ISN) which presents a common mode (asymmetric mode) impedance of 150 Ω to the telecommunication port under test (conversion factor is 20 log 10 150 / I = 44 dB).6 Limits for radiated disturbanceThe EUT shall meet the limits of Table 5 or Table 6 when measured at the measuring distance R in accordance with the methods described in Clause 10. If the reading on the measuring receiver shows fluctuations close to the limit, the reading shall be observed for at least 15 s at each measurement frequency; the highest reading shall be recorded, with the exception of any brief isolated high reading, which shall be ignored.___________2) See 3.6.Table 5 – Limits for radiated disturbance of class A ITE at a measuring distance of 10 mFrequency rangeMHz Quasi-peak limits dB(μV/m)30 to 230 40230 to 1 000 47NOTE 1 The lower limit shall apply at the transition frequency.NOTE 2 Additional provisions may be required for cases where interference occurs.Table 6 – Limits for radiated disturbance of class B ITEat a measuring distance of 10 mFrequency rangeMHz Quasi-peak limits dB(μV/m)30 to 230 30230 to 1 000 37NOTE 1 The lower limit shall apply at the transition frequency.NOTE 2 Additional provisions may be required for cases where interferenceoccurs.7 Interpretation of CISPR radio disturbance limit7.1 Significance of a CISPR limit7.1.1 A CISPR limit is a limit which is recommended to national authorities for incorporation in national publications, relevant legal regulations and official specifications. It is also recom-mended that international organizations use these limits.7.1.2The significance of the limits for equipment shall be that, on a statistical basis, at least 80 % of the mass-produced equipment complies with the limits with at least 80 % confidence.7.2 Application of limits in tests for conformity of equipment in series production7.2.1Tests shall be made:7.2.1.1Either on a sample of equipment of the type using the statistical method of evaluation set out in 7.2.3.7.2.1.2Or, for simplicity's sake, on one equipment only.7.2.2Subsequent tests are necessary from time to time on equipment taken at random from production, especially in the case referred to in 7.2.1.2.7.2.3Statistically assessed compliance with limits shall be made as follows:This test shall be performed on a sample of not less than five and not more than 12 items of the type. If, in exceptional circumstances, five items are not available, a sample of four or three shall be used. Compliance is judged from the following relationship:x kS +≤n L wherex is the arithmetic mean of the measured value of n items in the sample()S n x x n 2n 211=−−∑x n is the value of the individual itemL is the appropriate limitk is the factor derived from tables of the non-central t -distribution which assures with 80 %confidence that 80 % of the type is below the limit; the value of k depends on the sample size n and is stated below.The quantities x n , x , S n and L are expressed logarithmically: dB(μV), dB(μV/m) or dB(pW). n3 4 5 6 7 8 9 10 11 12 k 2,04 1,69 1,52 1,42 1,35 1,30 1,27 1,24 1,21 1,207.2.4 The banning of sales, or the withdrawal of a type approval, as a result of a dispute shall be considered only after tests have been carried out using the statistical method of evaluation in accordance with 7.2.1.1.8 General measurement conditions8.1 Ambient noiseA test site shall permit disturbances from the EUT to be distinguished from ambient noise. The suitability of the site in this respect can be determined by measuring the ambient noise levels with the EUT inoperative and ensuring that the noise level is at least 6 dB below the limits specified in Clauses 5 and 6.If at certain frequency bands the ambient noise is not 6 dB below the specified limit, the methods shown in 10.5 may be used to show compliance of the EUT to the specified limits. It is not necessary that the ambient noise level be 6 dB below the specified limit where both ambient noise and source disturbance combined do not exceed the specified limit. In this case the source emanation is considered to satisfy the specified limit. Where the combined ambient noise and source disturbance exceed the specified limit, the EUT shall not be judged to fail the specified limit unless it is demonstrated that, at any measurement frequency for which the limit is exceeded, two conditions are met:a) the ambient noise level is at least 6 dB below the source disturbance plus ambient noiselevel;b) the ambient noise level is at least 4,8 dB below the specified limit.。

Shenhua Ningxia Coal Industry Group Co. Ltd神华宁夏煤业集团有限责任公司Contract Title 合同标题Ningxia Coal Based Propylene Project宁夏煤基烯烃项目Integrated Project Management Team一体化项目管理组Yinchuan, Ningxia, P R China中国宁夏银川Document Title: 文件标题:NCPP IPMTPRESSURE RELIEF VALVE STANDARD泄压阀标准Document No.文件编号:SD-0000-PEN-080-0008ENGLISH LANGUAGE IS THE "ORIGINAL" LANGUAGE AND IF INCONSISTENCIES EXIST BETWEEN ENGLISH AND CHINESE VERSIONS, THE ENGLISH VERSION TAKES PRECEDENCE AND THE ENGLISH VERSION IS THE LEGALLY BINDING VERSION.原本以英文书就,如果英文和中文版本之间存在不一致,以英文版本为准,英文版本具有法律约束力。
A00 For Approved GZS 12/01/07 TDR00 For Review TD 20/11/06 - -Issue Rev 发布修订Issue or Revision Description发布或修改情况Origin by原作者Date日期Check by审核人Date日期ApprovedBy批准人Date日期Approve by批准人Date日期This Document is Owned by 本文件持有者TONY DWYER IPMT AuthorityIPMT授权批准HARD COPIES ARE UNCONTROLLED硬拷贝为非受控文件Pressure RELIEF VALVE Standard泄压阀标准Table of Contents目录1.0SCOPE 范围 (3)1.1Terminology 术语 (3)1.2Language 语言 (3)1.3Standardisation 标准化 (3)1.4Integrated Project Management Team (IPMT) Strategy一体化项目管理团队(IPMT)策略 (4)1.5Life Cycle Costs 寿命周期成本 (4)2.0REFERENCES 参考 (4)2.1Abbreviations and Acronyms 缩写词与缩略语 (4)2.2Codes and Standards 规范与标准 (6)2.3Reference Documents 参考文献 (9)3.0MECHANICAL DESIGN 机械设计 (9)4.0SELECTION OF VALVE TYPE 阀型选择 (13)5.0SIZING 尺寸选择 (14)6.0NAMEPLATES and TAGGING铭牌 (14)7.0PREPARATION FOR SHIPMENT 运输准备 (15)APPENDIX A - PIPE, VALVE AND FLANGE SIZES附录A 管道、阀门和法兰尺寸1.0 SCOPE 范围This Standard covers the minimum requirements for the design, materials, manufacturing of pressure relief valves to be provided for the Shenhua Ningxia Coal Group’s Ningxia Coal based Propylene Project which will be built at Ningdong Energy & Heavy Chemical Base, Lingwu city, Yinchuan in Ningxia Hui Autonomous Region, P R China. This Standard will be issued to all participating contractors for full compliance. Any exceptions shall be referred back to the NCPP Integrated Project Management Team (IPMT) for review and evaluation. This document will form part of the design basis of each NCPP contract.本文件对将建于宁夏回族自治区银川宁东能源化工基地的宁煤煤基烯烃项目中所使用的泄压阀在设计、材料以及制造方面的最低要求。

利用EndNote7.0写文章(转载)EndNote在安装时可以自动整合到Word 97、2000、XP中,使用者可以简单轻松地将EndNote7.0的库内文献加入到Word文档里,进而格式化引文形成合乎杂志要求的引文样式。
另外EndNote7.0提供各种文稿的模板,写文章实现了流水线模块化。
注意:最好先安装Word后再安装EndNote7.0,反之有可能不整合。
解决办法是重装EndNote7.0。
文稿模板:EndNote 提供了大量合乎各种杂志要求的稿件模板,收集在“Templates folder”里,写文章时选择合适的模板可大大简化写作过程。
文稿模板经过了格式化,对页边距、标题、行距、首页、摘要、图形位置、字型字号等都做了规范。
用模板书写文章的流程:1. 打开模板:从EndNote里打开:点击“Tools”下拉菜单里的“Manuscript Templates”后选择模板;或者从Word里打开:“新建”“通用模板”“EndNote” 选择模板。
2. 模板在Word里打开后,出现“Template Wizard”3. 依次填写“Template Wizard”所要求的信息,Template Wizard会将其转入到文章合适的位置。
4. 填写完后点击“Finish”,进入Word里的模板。
5. 按照版式填写。
“Cite While You Write”是EndNote7.0里与Word整合的元件,可以直接从Word的“工具”菜单里找到和使用。
“Cite While You Write”里的选项:1. Find Citation(s): 用于打开“EndNote Find Citations”对话框搜索和插入库内文献,其搜索方式是“任何字段”式的。
2. Go To EndNote: 打开EndNote3. Format Bibliography: 对引文样式进行格式化。
格式化就是将当前临时的引文转化成一定格式的引文,同时在文章结尾处自动生成引文列表。
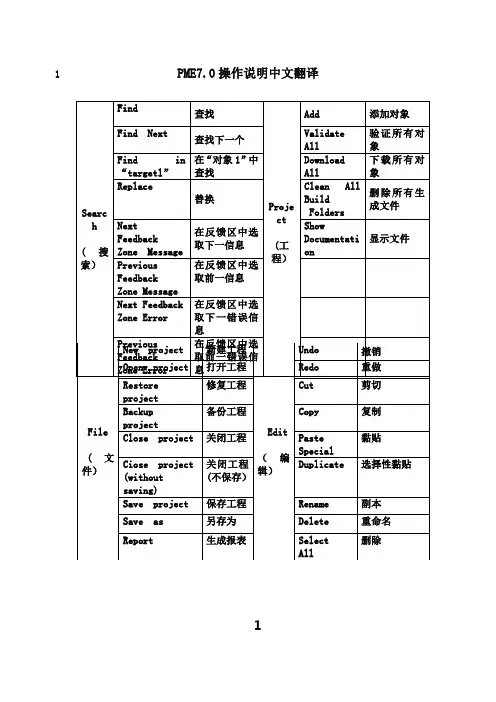
TABLE OF CONTENTSNO. DESCRIPTION1.0 PURPOSE 目的2.0 SCOPE 范围3.0 REFERENCES 参考4.0 DEFINITION 定义/说明5.0 PROCEDURES 程序6.0 SIGN OFF ITP ITP确认7.0 APPENDICES 附录APPENDIX1--- ITP For Mechanical & Electrical Assembly1.0 PURPOSE 目的The purpose of this Inspection and Testing Plan (ITP) is to identify and define the specific Quality Control Inspection Interventions and Testing activities to be performed at pre-defined stages by the inspection personnel consisting of ZPMC’s QC, ZPMC’s subcontractor, Client (Allseas) and classification society (Lloyds Register).ITP的目的是定义说明ZPMC质检、施工队,船级社及业主在设备安装过程中如何执行检查及测试,并有效的控制质量。
2.0 SCOPE 范围This ITP covers the Inspection and Testing of Electrical & Mechanical Installation disciplines, as mentioned in APPENDIX 1, as required by the Contract, Project Specifications and LR Classification Society Rules and identifies the specific involvement of ZPMC’s QC, ZPMC’s subcontractor, classification society and client’s inspection personnel in the Electrical & Mechanical Installation.ITP的执行范围按照附录1具体执行,要求项目过程中具体实施细节。

请大家记住:论文中,中英文摘要、正文和参考文献是最重要的部分,参考文献要懂得筛选,多用权威期刊或者论著,不要用一些乱七八糟的杂志的文章。
我们从现在开始要重视参考文献的格式,因为这是你们论文中错误最多的部分,现在把references的格式写对了,以后就专注改正文,以提高效率。
下列按照毕业论文的格式写,以后不按照这个格式,我都会打回去重写,再不改正只能在评语中注明“参考文献格式不正确”。
注意事项:1. 先列英文参考文献,后列中文,五号字体,英文用Times New Roman,中文用宋体(其实全部刷黑,选“Times New Roman”就可以了,宋体是默认的);中国人在中国的出版社、杂志上发表的文章,还是放在中文参考书目中,不要为了凑英文部分的数,直接翻译成英语;不要为了凑数,把一些无关论文的文章也列进来;一篇文献要么全是英文,要么全是中文,不要中英文并存2. 顺序:(注意标点符号的用法)(1) 专著、论文集、学位论文,例如[序号] 作者. (出版年). 文献题名. 出版地: 出版者.(2) 期刊文章,例如[序号] 作者. (出版年). 文献题名. 刊名, 卷(期): 起止页码.(3) 电子文献,例如[序号] 作者. 电子文献题名. 电子文献的出处或可获得地址, 发表日期或引用日期(自选).3. 按照姓的第一个字母或拼音从a-z的顺序排列,重复的按照第二个字母,以此类推,同一个作者的以第二个作者或书名、期刊名的第一个字母。
英文的作者先姓,后名(名用首字母缩写)4. 所有标点符号全部都是英文输入状态下的符号,即“[ ] ,.:”,标点符号之后记得要空一格,什么时候用哪个符号,一定要弄清楚5. 英文书名、期刊名用斜体,实词请全部首字母大写!!!!!!6. 外语类核心期刊有:外语教学与研究,外国语,外语与外语教学,外语界,现代外语,解放军外国语学院学报,外语教学,外语学刊,当代语言学,中国科技翻译,中国翻译,外语电化教学7. 最后请大家亲自打references部分,不要从别人的期刊直接copy不规范的文献格式。


总页数: 15页( 13页+2个附件: 2页)Total pages: 15 pages (13 pages + 2 appendices : 2 pages)目录TA BLE OF CONTENTS:1.目的OBJECTIVE (2)2.范围SCOPE (2)3.职责RESPONSIBILITIES (2)4.步骤PROCEDURE (3)4.0流程图Flowchart (3)4.1质量管理体系Quality Management System (4)4.2优良药品生产管理规范Good Manufacturing Practice (5)4.3管理原则Management Principle (6)5.术语GLOSSARY (13)6.参考文件REFERENCES (13)7.附件APPENDIX (13)8.其他相关信息RELA TED FORMS AND TRAINING MA TERIAL (13)8.1表格Forms (13)8.2培训资料Training Material (13)1. 目的OBJECTIVE2. 范围 SCOPE3. 职责 RESPONSIBILITIES4. 步骤 PROCEDURE4.0 流程图 Flowchart4.1 质量管理体系Quality Management System4.1.1. 介绍Introduction:上海葛兰素史克的质量体系是一个具有生命力的系统,全面的政策,支持的过程和与法规要求一致的程序,并在公司内部进行积极的管理Quality Management system is a living system with comprehensive policies, supported by process and procedure aligned to regulatory requirement and requiring active management in GSKBS该体系的输入为: Input of this system-Global Requirements (including GQPs, GQMPs, GSOPs, Global Quality Council Communication and GlobalQuality Alert……)全球要求(包括GQPs, GQMPs, GSOPs, 全球质量管理会议沟通和质量警报)-Continuous Improvement based on process基于过程的持续改进-Regulatory Requirements 法规政策4.1.2. 详细步骤Detailed step4.2 优良药品生产管理规范Good Manufacturing Practice4.2.1. 介绍Introduction优良药品生产管理规范是药品生产的最低要求,也是确定我们做正确的事,并正确地做事的过程.Good Manufacturing Practice is the regulatory requirement for drug manufacturing, and a process to ensuring that we do right things, and do things right.从八个方面进行介绍Introduce GMP from eight sections:4.2.1.1 管理Management4.2.1.2 人员Personnel4.2.1.3 文件和数据Documentation & Data4.2.1.4 设施Facilities4.2.1.5 物料与产品控制Material and Product Control4.2.1.6 过程保证Process Assurance4.2.1.7 分析控制Analytical Controls4.2.1.8 事件管理Incident Management所有有关的文件可以参考S:\SOP\Controlled Documents。

The Data Room provides …EoM Report on EIA evaluation for Lithuania" conducted on 26-30 of January, 2009 on the basis of the EIA report. The main conclusion which is presented in the I A E A report states that the EIA report provides enough information, analys is and conclusions for a project at this stage to make an appropriate decision in order to proceed to the subsequent steps in the process to build a new NPP in Lithuania.IAEA report constitutes of recommendations and comments for the EIA which according to VAE opinion were evaluated and reflected in the final version of EIA report.This opinion of VAE is presented for informational purposes only and reflects only the understanding of VAE, it shall not be considered as contradicting, replacing or otherwise affecting already delivered and that to be delivered in future reports and opinions of IAEA. VAE does not intend to affect any reader of this document by its opinion; each document reader has to evaluate the correctness of the statement expressed in this opinion on its own efforts. In this regard no representation, warranty or undertaking, express or implied, is or will be given and no responsibility or liability is or will be accepted by VAE, or by any of its directors, officers, employees‟ agents or advis ers, in relation to the accuracy or completeness of this opinion or any other written or oral information made available in connection with this opinion. VAE waives any liability and the reimbursement of any damages incurred or for any losses suffered in connection to the use of this opinion or any part of it. So far as is permitted in law, any responsibility or liability for such information is expressly disclaimed."Mr Ovidijus Sestokas Wagramer Strase S .PO Box 100.1400 Wren AusinaPhone (-43 1)2600 Fax (-43 1)26007Email Official Mad@ Internet http://www.State Nuclear Power Safety Inspectorate In reply please refer LIT/9/009Dial directly to esension (-43 1) 2600-22331(VATESI)A.Gostauto Strcet 1201108 VilniusLithuania2009-07-23Subject End of Mission Report on LIT/9/009Dear Mr SestokasEnclosed please find the report No.IAEA-TCR-04758 of the mission to Vilnius(Lithuama),from 2009-01-26 to 2009-01-30,prepared by Dr Michel Chartier Dr Peter Hacker,Mr Neil Harman Mr Justin G Smith,and Mr Brian Turland who served as experts under the project LIT/9/009 "Enhancing capabilities in VATESI and institutions in the licensing of a new NPP".task with the title "Expert mission for the evaluation of Environmental impact assessment report for a new nuclear power plant in Lithuania.Please do not hesitate to contact us,should you have any questions or comments regarding the report and its recommendations.Yours sincerely,Oscar AcunaHead Europe Section 2Division for EuropeDepartment of Technical CooperationEnclosureCc:TCNLO+Vienna MissionIAEA-TCR-04758 INTERNATIONAL ATOMIC ENERGY AGENCY(IAEA-TCR-04758)"Enhancing capabilities in VATESI and other institutions in the licensing of anew NPP"Europe Section 2Contents1. INTRODUCTION (1)1.1 Background (1)1.2 IAEA International Mission of Experts (1)1.2.1 Framework (2)1.2.2 Participants (2)1.2.3 Scope of the review (3)1.2.4 Work done (3)1.2.5 Structure of the Mission Report (4)2. MAIN CONCLUSION (4)3. FINDINGS, CONCLUSIONS AND RECOMMENDATIONS (5)3.1 Scope and format of the EI A Report (5)3.2 Radiological impact from discharges during normal operation (6)3.2.1 Principal conclusion (6)3.2.2 Comments (6)3.2.3 Transboundary considerations (8)3.3 Consideration of accidental release scenarios (9)3.3.1 Principal conclusion (9)3.3.2 Comments (9)3.4 Hydrogcological aspects (12)3.4.1 Comments (12)3.5 Radioactive waste (13)3.6 Impacts from ancillary activities (13)3.7 Public consultation (13)3.8 Consideration of external events and impacts (14)4. ADDITIONAL COMMENTS (14)4.1 Hydrogeological and hydrological aspects (14)4.1.1 The state of waters (14)4.2 Accident analysis (15)4.3 Risk assessment (17)REFERENCES (21)APPENDIX I. IAEA EXPERT MISSION PARTICIPANTS (23)APPENDIX II. INITIAL RESPONSES BY PÔYRY ENERGY OY-LITHUANIAN ENERGY INSTITUTE (25)1. INTRODUCTION1.1BackgroundWithin the process for the authorization of the construction of a new nuclear power plant (NPP) in Lithuania, the organizer of the proposed economic activity, Visagino Atomine Electrine, UAB (VAE), entrusted the consortium Poyry Energy Oy-Lithuanian Energy Institute (Poyry-LEI) to develop an Environmental Impact Assessment (EIA).The EI A is a prerequisite of the early stages of the decision making process for the construction of this relevant installation as established in national and international legislations of relevance for Lithuania, and has the objective to describe how the enterprise would influence the surrounding environment and evaluate whether the impacts of the project are environmentally and socially acceptable. The EIA studies under consideration were structured in order to determine whether the proposed economic activity may be carried out at the chosen site or sites; to identify and to evaluate viable alternatives of the project; to assess potential environmental impacts of the proposed economic activity and to ensure that environmental matters are taken into account before the development consent is given and; to provide information on the proposed economic activity for all EIA participants and stakeholders.Within the EIA procedure, a public review was carried out to which the local and international communities were invited to participate. Once the local and international communities have had the opportunity to register their comments on the EIA report, the Lithuanian Ministry of Environment will be responsible for its approval. This approval is necessary before the project is entitled to proceed. The EIA procedure started in May 2007 and many steps were already accomplished at the time that the IAEA Mission took place (described in Section 1.2 below). These steps included preparation of the EIA Programme, submission of the Preliminary EIA Programme to all involved parties, domestic and international commenting, submission of the Final EIA Programme to the competent authority, approval of the Programme.The EIA Report was initiated in November 2007 and by October 2008, the preliminary report was presented for comment. During this period for receiving comments from stakeholders, the International Atomic Energy Agency (IAEA), in its role as an UN International Organization specialized in nuclear and radiological safety, was invited by the Govemnleht of Lithuania to review the EIA Report and produce an appraisal based on the application of IAEA International Safety Standards.1.2IAEA International Mission of ExpertsFollowing the request of the Government of Lithuania, the IAEA organized an appraisal of the EIA Report for a new NPP by means of an International Expert Mission. The Mission took place in Vilnius from 26 to 30 January 2009.The appraisal was organized in accordance with the functions established under Article III.A.6 of the IAEA Statute, namely to provide for the application of its international safety standards for radiation protection of workers, public and the environment. Additionally, recognized good practices in radiological and nuclear safety and the background of the selected experts were considered during the appraisal activities.1.2.1FrameworkThe reference framework that governed the implementation of the appraisal by the IAEA was the international standards applicable to radiation protection and safety—that is, the Fundamental Safety Principles1 [1], and the International Basic Safety Standards for Protection against Ionizing Radiation and for the Safety of Radiation Sources'2 [2], These standards are based on the comprehensive scientific review of the effects of ionizing radiation carried out by the United Nation Scientific Committee on the Effects of Atomic Radiation (UNSCEAR), which and can be found in its reports [3-5], and the current recommendations on radiological protection by the International Commission on Radiological Protection3 (ICRP) published in 1991 [6] and updated in 2007 [7],The following specific IAEA nuclear and radiological safety guides were also used as references: —Generic Models for Use in Assessing the Impact of Discharges of Radioactive Substances to the Environment [8];—Regulatory Control of Radioactive Discharges to the Environment [9];—Environmental and Source Monitoring for Purposes of Radiation Protection [10]; and —Dispersion of Radioactive Material in Air and Water and Consideration of Population Distribution in Site Evaluation for Nuclear Power Plants [11],Applicable national and other international regulations which were used to conduct the EIA were also considered during the review, e.g., European Council Directive on the assessment of the effects of certain public and private projects on the environment [12],1.2.2ParticipantsThe Mission was carried out by a team of six international experts from Argentina. Austria. France and 2 from the UK. whose expertise included the following fields:—radioactive discharges and their behaviour in the environment;—assessment of doses due to exposure to radioactive materials in the environment and radiological risk assessment;—nuclear accident analysis (accident selection and source term characterization);—radioactive waste management; and—hydrogeology/hydrology and meteorology in connection with radiological impact.The experts nominated by the IAEA were:1Cosponsored by the IAEA, the World Health Organization (WHO), the Pan American Health Organization (PAHO), the International Labour Organization (ILO), the Food and Agric ulture Organization of the United Nations (FAO), the Nuc lear Energy Agenc y of the Organization for Ec onomic Cooperation and Development (OECD/NEA), the European Atomic Energy Community (EURATOM), the International Maritime Organization (IMO) and the United Nations Environment Programme (UNEP).2Cosponsored by the IAEA, WHO, PAHO, ILO, FAO and OECD/NEA.3The ICRP is the independent non-governmental organization whic h defines the "system for radiation protection" on whic h international standards for radiation protection (as are those from the IAEA) and many national standards are founded.—— Mr Justin Smith, Environmental Assessments Department, Centre for Radiation, Chemical and Environmental Hazards, Radiation Protection Division, Health Protection Agency, UK;—— Mr Brian Turland, Team Leader of the Reactor Analysis, Nuclear Services, CivilNuclear Business Group, Serco Technical and Assurance Services, UK;—— Mr Neil Harman, Decommissioning and Safety Management Department, Civil Nuclear Business Group, Technical and Assurance Services, Serco Limited, UK;—— Mr Peter Hacker, Senior Hydrogeologist, formerly Austrian Research Centers Seibersdorf GmbH (ARCS), Austria;——Mr Michel Chartier, Institut de Radioprotection et de Surete Nucleaire , Deputy Head of the Department Environment and Intervention, France; and——Mr Diego Telleria, Assessment and Management of Environmental Releases Unit, Division ofRadiation, Waste and Transport Safely, IAEA (Mission Coordinator).A brief description of the professional backgrounds of the nominated experts is presented in Appendix I.1.2.3Scope of the reviewClearly, since the IAEA is concerned with the effects of ionizing radiation, the main focus of the Review Mission was on the radiological impacts included in the EIA Report, although the general aspects and other enviromnerital impacts were considered where possible.In addition to the review of the EIA Main Report, some specific topics with significant influence in the EIA results from the radiological point of view were analyzed in more detail by the experts, in accordance with their main fields of expertise.Due to the programmed amount of time for the review and the substantial extent of the report, it was not in the objectives of the Mission to carry out detailed independent studies or recalculations on any of the data presented. The conclusions of the Mission have therefore been made on the basis that a ll the statements, information, calculations and data presented in the EIA Report are correct and accurately reflect the situation in the Project.1.2.4Work doneThe work done during the Mission in Lithuania consisted of an intensive review of the EIA Report and related technical references, presentations by representatives of the responsible organizations in Lithuania and their teams of national and international consultants, and subsequent interviews to clarify or expand on the information as required.Subsequent to this work, a preliminary report was prepared and presented for consideration to the counterparts in Lithuania during a final meeting before closing the Mission. The preliminary report was the basis for the preparation of the present Mission Report.Within the period of preparation of this Mission Report, Poyry-LEI and VAE prepared answers to all of the preliminary comments of the experts of the IAEA Mission. In order to complement the results of the IAEA Mission to Lithuania the answers prepared by Poyry-LEI and VAE are included in this report (Appendix II). Notwithstanding the fact that a number of the answers provided seem to address the comments made by the IAEA team of experts, the present report does not include an evaluation of those answers in detail.A new version of the EIA Report, which will include additional information and if deemed necessary the amendments made according to the IAEA experts' comments, will be available in due course.However, it is important to note that the ongoing discussions and additional work which is taking place in Lithuania to improve the EIA Report in future versions, does not affect the main conclusion of the Mission regarding the validity of the EIA Report reviewed (Version, 22 December 2008) and the implication for continuing with the decision making process regarding the feasibility to construct the new NPP.1.2.5Structure of the Mission ReportAfter the introduction in Section 1, the IAEA Mission Report presents the main conclusion from the Mission in Section 2. Section 3 presents the findings and conclusions which are the basis for the main conclusion and, when possible, gives recommendations on how to address the topics needing additional work. These findings, conclusions and recommendations cover both general and specific issues. A set of additional observations by the international experts are also included in Section 4. The appendices of the document include complementary information, including the above mentioned answers prepared by Poyry-LEI and VAE to the preliminary comments from the IAEA team of experts during the Mission in Lithuania (see explanations in Section 1.2.4). For later reference, the paragraphs under Section 3 are numbered.2. MAIN CONCLUSIONThe conclusion of the Mission of international experts organized by the IAEA is that the EIA Report, New Nuclear Power Plant in Lithuania - Version, 22 December 2008, provides enough information, analysis and conclusions for a project at this stage, to make an appropriate decision in order to proceed to the subsequent steps in the process to build a new NPP in Lithuania, provided andconsidering that:—this is one of the early stages of a decision process;—a s indicated, the proposed NPP would be one of the considered Generation III/III+ NPPs; —subsequent more detailed and more specific studies (like tho&f for the future Siting Report and Safety Report) will be carried out on relevant aspects such as nuclear safety and radiological protection of the public and environment, amongst others; and—the licensing by the nuclear regulatory body and other competent authorities will be in accordance with national and international standards and recommendations, as part of the final stages of this process.Despite the main conclusion given above, a number of areas where the EIA Report could need improvement were identified during the appraisal the Mission. It is recommended that the comments provided by the Mission relating to these areas be considered in the subsequent stages of the process. These comments are included in the following Sections of this report.3. FINDINGS, CONCLUSIONS AND RECOMMENDATIONS3.1Scope and format of the EI A Report(1)The Report states that it was prepared in accordance with the Law on Environmental Impact ofProposed Economic Activity of the Republic of Lithuania (State Journal, 2005. No. 84-3105) and this law implements European Union (EU) Directive 85/337/EEC and amendments. The EU has produced Guidance on Reviewing Environmental Impact Statements (EIS) [13] and, consequently, in addition to the IAEA Safety Standards and guidance used as a reference covering the radiological impact elements, the above mentioned EU Guidance was used by the Mission as a guide in reviewing the Report.(2)There is neither a clear definition of the specific objectives of this particular study nor anoverall conclusion to the EIA Report discussing whether its objectives have been met (i.e., there are no chapters entitled 'Objectives of this EIA Report' and 'Conclusions of this EIA report').The objectives stated within the text of the Report are those generally defined under the Lithuanian Law for any environmental impact assessment. Specific objectives of this particular EIA (for example, 'to fulfil the legal requirements by showing that the impacts from the construction, operation, and decommissioning of any of the available Generation III/III+ technologies NPP considered would be acceptable at the site selected', etc.) and the consequent discussion of its fulfilment should be included.(3)The discussion of the reasons previously considered in Lithuania, which made the nuclearoption valid and. in principle, convenient to be located in one of the proposed sites (which, from many perspectives, it could be considered as a single site) could be given more prominence.(4)Some of the detailed objectives which could be interpreted from the EIA Report, as well asthose from the presentations made during the IAEA Mission, could be a little too ambitious at this stage. For example, some of the studies to obtain definitive parameters (like lake temperature) would benefit from more information and further investigation before final conclusions are reached. The same applies to some of the conclusions drawn from the radiological impact assessment because the radiological parameters used for the analysis will be strongly dependent on the selected technology. A less prescriptive view might therefore be more appropriate at this stage.(5)The Executive Summary (page 15 of the EIA Report) is more of an introduction than an'Executive Summary', which should be capable of being read as a stand-alone document; it should therefore be expanded to include, for example, summaries of the results of the studies carried out (maps, tables, figures, etc.), and the conclusions.(6)The description of the EIA procedure (Chapter 2) should be more detailed and discuss the othersteps in the process, for example:—selection of the reactor technology;—selections of other options for the Project such as siting and cooling technologies; —revision of the EIA Report in light of the selected option and its consideration for the specific reactor design, number of reactors, and other technologies selected; and—the Article 37 submission.(7)As it stands, the Report implies that this is the final step and, if approved, no further submittalsor approvals would be required. This confusion is compounded by the lack of an overall conclusion and a clear statement of the objectives as mentioned above.(8)The report does not include a Non-Technical Summary which is a requirement of the EUDirective and presumably the Lithuanian Law. According to the previously mentioned EIS Guidance [13],such a Summary should:—provide a concise but comprehensive description of the Project, its environment, the effects of the Project on the environment and the proposed mitigation;—highlight any significant uncertainties about the Project and its environmental effects; —explain the development consent process for the Project and the role of EIA in this process; —p r o v id e an overview of the approach to the assessment;—b e written in non-technical language, avoiding technical terms, detailed data and scientific discussion; and—be comprehensible to a lay members of the public.Without this, the Project may be open to challenge at a later date using the argument that since no non-technical summary was provided, it was not possible to fully understand the Project and therefore that the opportunity to object was denied.3.2Radiological impact from discharges during normal operation3.2.1Principal conclusion(9)Methods which have been used to assess the impact of routine discharges are robust standardmethods which are relevant for the objectives of the EIA Report. The application of these methods to the anticipated discharges of the new NPP is supported by scientific peer- reviewed publications. Although the verification of the calculations was not carried out by the experts, as this was beyond the aim of the IAEA Mission, experts did not identify evident inconsistencies in the order of magnitude of the assessed dose and express a general agreement on the methods used for the impact assessment of routine discharges at this stage of the project.(10)The following comments should be considered in the subsequent developments of the EIAprocess or more detailed future assessments such as a Safety Assessment Report:3.2.2Comments(11)For the local Lithuanian population, doses to theoretical critical groups are based on theassessment methodology from the LAND42 report and supporting documents. There appear to be many assumptions about input data, such as habit data, that are not based on survey information. One supporting paper makes reference to suburban gardens close to the lake, but it is not clear where these are located or if they actually exist.(12)While it is understandable that the use of the LAND standard ensures compliance with nationalrequirements, as mentioned, the associated tools for modelling are only applicable for critical groups, which are 'tools' to control discharges from nuclear installations more than to assesses the general impact. Therefore, the EIA Report should cover additional groups of individuals that better represent more typical members of the population, this being the objective of the EIA Report. It might be worth reconsidering the use of the term 'critical group' and if it could be replaced by a better expression with fewer connotations (such as •reference group‟).Alternatively, a footnote could be included to explain that in radiological protection terminology …critical group' has a well defined meaning which does not necessarily mean these people are in critical situations. In addition, accepting that the LAND based calculations must6be kept in the report, it is suggested that firstly (and separately) IAEA [8] is used for all the dose calculations and, where possible, survey data. Complete tables of annual dose as a function of distance and direction up to 20-50 km could then be presented. Subsequent to this, the results of LAND could be presented under another subheading, for instance …compliance with n ational regulations'.(13)It would be useful to include a table with relevant habit data of the population for all theconsidered pathways and age groups. These might be the results of surveys or proposals from literature (i.e.,…Generic Models for Use in Asses sing the Impact of Discharges of Radioactive Substances to the Environment' [8] or other), but it is important that the external observer can see these assumptions.(14)The approach in [8] is also used for particular critical groups, e.g., individual spending largeamounts of time near the site fence. Habit data from [8] are quite conservative (see Paragraph12 above).(15)Impact assessment of routine discharges includes: (a) a dose assessment for the critical groupusing the Lithuanian normative method; (b) a dose assessment for other Lithuanian groups of population for airborne discharges at the border of the denominated Sanitary Protection Zone (SPZ) using the IAEA methodology [8]; and (c) a dose assessment for population groups in other countries using the IAEA methodology in [8] for airborne discharges) and an adapted PC CREAM method for liquid discharges. This might be confusing for non-experts in terms of interpretation. The reasons for these various approaches should be clarified and the differences in models should be explained and appraised (for instance, there are differences in the exposure pathways taken into account by the various methods).(16)Levels of discharge used to assess the radiological impact of normal operations of the variousreactor technologies are derived using numerical methods which may include significant uncertainties (e.g., overestimations) and do not necessarily represent the real future discharges for each reactor type (e.g., the implementation of optimised effluent treatment systems may reduce discharged activities significantly for some nuclides). The discharges displayed in Table7.1-34 are assumed to be an envelope of foreseen discharges (although this is not clearly provenin the report, but nonetheless a reasonable approach at this stage). The dose assessment results are therefore an indication of the potential (probably maximized) impact of the routine discharges for each reactor type, but the assessed impact is not accurate enough to be an input parameter for the choice of the reactor technology. The range of doses for the various reactor types given in Table 7.10-29 is only indicative. The report should make clear that the results of the impact assessment of the routine discharges shown in the report cannot be used to rank reactor performance at this stage.(17)The report should make clear that authorised discharge limits may well be set by Lithuaniancompetent authorities at different levels from the discharges displayed in Tables 7.1-34 and7.2-11, although these discharge data are assumed to be the envelope of routine discharges foreach reactor technology.(18)The EIA Report (page 437) indicates that the dose to the critical group should take into accountthe committed effective doses per unit intake by inhalation of various age groups (Lithuanian Hygiene Standard HN 73:2001). During the discussions held as part of this Mission, it was mentioned that different age groups were considered. However, this is not clearly presented in the EIA Report; for instance, the report does not indicate whether only adult farmers have been considered or also their families. The Report should give appropriate information on the way in which the impact of routine discharges has been assessed on various age groups and, as necessary, on the most exposed age group for the various critical groups considered.7(19)Potential changes to the use of the lake and surrounding area might be considered as these maylead to unexpected exposure pathways.(20)The Report would benefit from a better description of some of the radiological impactassessment methods (e.g., the LAND methodology) and discussions on the uncertainties and degree of conservatism (use of existing references to improve descriptions). The main features of the methods, as well as the values and reference of the main input data (e.g., dose coefficients, food consumption rates, etc.) should be detailed. In particular, the reason why the methods are considered conservative should be fully explained (e.g., assessment at the location of maximum deposition, food consumption rates twice the average Lithuanian food consumption rates, protection by buildings not taken into account, etc.). Also, the use of local/site specific or generic data should be made clear.(21)Five 'critical groups' have beem defined (farmers, gardeners, fishermen, local resident whopasses the SPZ, local resident at the border of the SPZ). This is intended to cover bounding situations in relation with radiological impact of routine discharges. On the other hand, this gives no indication of the impact on ihe general population which should be even lower. An assessment of the radiological impact to a broader group of the population living in the nearest large urban zones (e.g., Visaginas, Daugavpils, etc.) would be useful as a complementary result.3.2.3Transboundary considerations(22)For waterborne discharges the PC CREAM methodology is used although it has been adaptedfor the local conditions at Ignalina (Lithuania) and details of this process are not always clear.(23)For atmospheric discharges the approach in [8] is used which is likely to be conservative.However, survey data are unavailable for Belarus and therefore it is difficult to put these dose estimates into context.(24) A useful way of demonstrating the relative impacts on the host country and neighbouring stateswould be to calculate the collective dose from normal operations in each state, this can then be weighed against the relative benefits to each state accruing from the Project.8。
目录一、前言 (2)二、科研工作的好帮手-Endnote (5)三、教程上:基础篇 (6)四:教程中:应用篇 (10)五:教程下:杂项篇 (16)EndNote使用指南一、前言工欲善其事,必先利其器。
做事情,有工具会事半功倍。
做科学研究,写论文也是这样,也需要工具,才会省力气。
我是学工科的,到现在已经发表了4篇英文论文,我建议大家用Endnote7.0和word 2003写英文论文。
1)首先下载Endnote7.0,然后安装。
2)运行Endnote7.0,创立一个文件,比如取名为reference.enl,然后导入自己平常收集的参考文献。
导入的方法有:自己一篇一篇输入,按author,paper title,journal title,volume,page number.,year 的顺序。
不过假如自己收集了好多文献,这样一篇一篇地输入,自己就累死了。
正版Endnote7.0这个软件,自己可以连接到web of science,然后查找到你要的文献,然后自动导入。
当然大部分情况下,也是一篇一篇导入。
不过比第一种方法至少算是进步了。
因为不需要自己一个一个地输入。
假如你的学校,单位有钱,购买了web of science,那么你就可以通过Internet Explorer 浏览web of science,在网页上查找你要的文献,然后选中你要的,在这些文献前面的方框里打钩,然后按submitted,然后将这些选中的文献export to reference software,这个方法可以一次导入好多篇文献。
效率高。
经过一段时间的工作,你的reference.enl 可能已经收集了100篇文献了。
那么就可以开始写论文了。
先不要关闭Endnote7.0这个软件。
下面有用。
3)打开word2003,发现工具栏自动添加了Endnote的好几个图标。
不用管太多,先写论文吧。
IntroductionWith the development of recombinant biotechnology in the last two decades, PCR has been used as a routine method.写到这里,你可能要插入参考文献了。
EUROPEAN NEW CAR ASSESSMENT PROGRAMME(Euro NCAP)PEDESTRIANTESTING PROTOCOLImplementation 2014Version 7.0March 2013Copyright ©Euro NCAP - This work is the intellectual property of Euro NCAP. Permission is granted for this material to be shared for non-commercial, educational purposes, provided that this copyright statement appears on the reproduced materials and notice is given that the copying is by permission of Euro NCAP. To disseminate otherwise or to republish requires written permission from Euro NCAP.Version 7.0Preface∙ Where text is contained within square brackets this denotes that the procedure being discussed is currently being trialled in Euro NCAP. Its incorporation in the Test Protocol will be reviewed at a later date.∙During the test preparation, vehicle manufacturers are encouraged to liaise with the laboratory and to check that they are satisfied with the way cars are set up for testing. Where a manufacturer feels that a particular item should be altered, they should ask the laboratory staff to make any necessary changes. Manufacturers are forbidden from making changes to any parameter that will influence the test, such as dummy positioning, vehicle setting, laboratory environment etc.∙ It is the responsibility of the test laboratory to ensure that any requested changes satisfy the requirements of Euro NCAP. Where a disagreement exists between the laboratory and manufacturer, the Euro NCAP secretariat should be informed immediately to pass final judgment. Where the laboratory staff suspect that a manufacturer has interfered with any of the set up, the manufacturer's representative should be warned that they are not allowed to do so themselves. They should also be informed that if another incident occurs, they will be asked to leave the test site.∙Where there is a recurrence of the problem, the manufacturer’s representative will be told to leave the test site and the Secretary General should be immediately informed. Any such incident may be reported by the Secretary General to the manufacturer and the person concerned may not be allowed to attend further Euro NCAP tests.DISCLAIMER: Euro NCAP has taken all reasonable care to ensure that the information published in this protocol is accurate and reflects the technical decisions taken by the organisation. In the unlikely event that this protocol contains a typographical error or any other inaccuracy, Euro NCAP reserves the right to make corrections and determine the assessment and subsequent result of the affected requirement(s).Version 7.0The following information will be required from the vehicle manufacturer before any pedestrian test preparation begins.• Manufacturer grid marking coordinates relative to an identifiable location on the vehicle.• Predicted colour or HIC data clearly identifying defaulted points.• Justification for all blue points.• Number of Manufacturer funded verification headform tests max (10).• Number of Manufacturer funded blue point tests (8 max).• Manufacturer funded upper legform to bonnet leading edge tests and legform to bumper tests. • Active hood description and supporting data (where applicable).• Details of the vehicle’s normal ride attitude, e.g. wheel arch height.Version 7.0ContentsPage No. 1VEHICLE PREPARATION 11.1Unladen Kerb Weight 11.2Additional Weights 11.3Suspension Settling 11.4Normal Ride Attitude 1 2ASSESSMENT OF VEHICLES WITH ACTIVE BONNETS 32.1Prerequisites to Assessment 32.2Detection of Pedestrians 32.3Timing of Bonnet Deployment 62.4Protection at Speeds below the Deployment Threshold 72.5Protection at Higher Impact Speeds 82.6Bonnet Deflection due to Body Loading 8 3VEHICLE MARKING 113.1General 113.2Bumper Reference Lines 113.3Bumper Corners and Bumper Test Zone 133.4Bonnet Leading Edge Reference Line 143.5Bonnet Side Reference Line 153.6Corner Reference Point 163.7Bonnet Rear Reference Line 163.8Marking Wrap Around Distances 183.9Marking Headform Impact Area Grid Points 203.10Identification of the Headform Grid Points 223.11Marking Upper Legform Grid Points 233.12Marking Legform Grid Points 233.13Labelling the Leg Grid Points 24 4Headform DATA 254.1Manufacturer Supplied Data 254.2Unpredictable Grid Locations 264.3Absence of Manufacturer Data 26 5HEADFORM VERIFICATION TESTS 275.1Verification Tests 275.2Headform Tests 27 6DETERMINATION OF LEG IMPACT POINTS 296.1Legform to Bumper Tests 296.2Upper Legform to Bumper Tests 296.3Upper Legform to Bonnet Leading Edge Tests 29 7RECORDING THE IMPACT POINT LOCATIONS 317.1General 317.2Measuring Impact Points 317.3Transferring Impact Points to Replacement Vehicle Parts 318PERFORMING OF PEDESTRIAN IMPACT TESTS 328.1General 328.2Propulsion System 328.3Fitting Replacement Parts to Vehicles 328.4Photographic Record 328.5Testing Deployable Bonnets 32 9LEGFORM TESTS 359.1Description of Legform and its Instrumentation 359.2Certification 359.3Test Procedure - Pre Test 359.4Compensation for Gravity (horizontal firing) 369.5Ballistic Compensation 379.6Test Procedure - Post Test 39 10UPPER LEGFORM TO BUMPER TESTS 4010.1Description of Upper Legform and its Instrumentation 4010.2Certification 4010.3Test procedure - Pre-test 4010.4Test Procedure - Post Test 41 11UPPER LEGFORM TO BONNET LEADING EDGE TESTS 4211.1Description of Upper Legform and its Instrumentation 4211.2Certification 4211.3Bumper Lead 4211.4Bonnet Leading Edge Height 4211.5Determination of Impact Velocity, Impact Angle and Impact Energy 4311.6Test procedure - Pre-test 4711.7Test Procedure - Post Test 48 12HEADFORM TESTING 4912.1Description of Headforms and Their Instrumentation 4912.2Certification - Dynamic 4912.3Test Procedure - Pre Test 4912.4Test Procedure - Post Test 50 13INJURY PARAMETERS 5113.1General 5113.2Limits 51 GLOSSARY OF TERMS 53 REFERENCES 531VEHICLE PREPARATION1.1Unladen Kerb Weight1.1.1The capacity of the fuel tank will be specified in the manufacturer’s booklet.Thisvolume will be referred to throughout as the ‘fuel tank capacity’.1.1.2Syphon most of the fuel from the tank and then run the car until it has run out of fuel. 1.1.3Refill the fuel tank with fuel (or an equivalent mass of water or other ballast) to its fueltank capacity.1.1.4Check the oil level and top up to its maximum level if necessary. Similarly, top up thelevels of all other fluids to their maximum levels if necessary.1.1.5Ensure that the vehicle has its spare wheel on board along with any tools supplied withthe vehicle. Nothing else should be in the vehicle.1.1.6Ensure that all tyres are inflated according to the manufacturer’s instructions for halfload.1.1.7Remove the front vehicle license plate and its holder/brackets if these are removablefrom the bumper.1.1.8Measure the front and rear axle weights and determine the total weight of the vehicle.The total weight is the ‘unladen kerb weight’ of the vehicle. Record this weight in thetest details.1.2Additional Weights1.2.1Put the fore-aft adjustment of both front seats in their mid-positions. If there is no notchat the mid-position, use the first notch immediately rearward.1.2.2Place a 75kg mass on the driver’s seat and a 75kg mass on the front passenger’s seat. 1.2.3Ensure that the front wheels are in the straight ahead position.1.2.4If the suspension is adjustable in any way, ensure that the vehicle is at the correctattitude for travelling at 40km/h. See Section 1.4.1.3Suspension Settling1.3.1Roll the vehicle forwards by a distance of at least 1 metre1.3.2Roll the vehicle backwards by a distance of at least 1 metre1.3.3Repeat steps 1.3.1 and 1.3.2 for three complete cycles. Note: This procedure may beinappropriate for cars which have to be set up as described in Section 1.2.4.1.3.4Measure and record the ride heights of the vehicle at the point on the wheel arch in thesame transverse plane as the wheel centres. Do this for all four wheels.1.4Normal Ride Attitude1.4.1After following the above procedures the vehicle is in its Normal Ride Attitude whenthe vehicle attitude is in running order positioned on the ground, with the tyres inflatedto the recommended pressures, the front wheels in the straight-ahead position, withmaximum capacity of all fluids necessary for operation of the vehicle, with all standardequipment as provided by the vehicle manufacturer, with a 75kg mass placed on thedriver's seat and with a 75kg mass placed on the front passenger's seat, and with thesuspension set for a driving speed of 40km/h in normal running conditions specified bythe manufacturer (especially for vehicles with an active suspension or a device forautomatic levelling).1.4.2The manufacturer shall specify the Normal Ride Attitude with reference to the vertical(Z) position of any marks, holes, surfaces and identification signs on the vehicle body,above the ground. These marks shall be selected such as to be able to easily check thevehicle front and rear ride heights and vehicle attitude. If the reference marks are foundto be within 25mm of the design position in the vertical (Z) axis, then the designposition shall be considered to be the normal ride height. If this condition is met, eitherthe vehicle shall be adjusted to the design position, or all further measurements shall beadjusted, and tests performed, to simulate the vehicle being at the design position.1.4.3All ride heights measured are the Normal Ride Attitude ride heights.2ASSESSMENT OF VEHICLES WITH ACTIVE BONNETS2.1Prerequisites to Assessment2.1.1Prior to the testing and assessment of a vehicle equipped with an active bonnet, thevehicle manufacturer must liaise with the Euro NCAP secretariat and test laboratory.This should begin several weeks before the scheduled test date.2.1.2In order for active systems to be assessed in the deployed position or for the system tobe deployed during the tests, it will be necessary for the vehicle manufacturer toprovide the Euro NCAP Secretariat with the relevant detailed information highlightedin the following sections.2.1.3The vehicle manufacturer is responsible for providing all necessary information,detailed in this protocol, to the Euro NCAP Secretariat regarding detection ofpedestrians and the deployment of the system. Based on the evidence provided, theSecretariat will decide whether or not the vehicle qualifies for assessment in either thedeployed or undeployed position or if dynamic tests are required.2.1.4General information is also required regarding the functionality of the system alongwith specific details of the sensing, trigger and deployment systems.2.1.5The vehicle manufacturer must ensure that the test laboratory is given adequateinformation regarding the replacement of consumable components, system triggerrequirements, details of any health hazards and sufficient spare parts to ensure thattesting can be performed on schedule.2.1.6Where there is no information, a lack of sufficient information or the system does notmeet the Euro NCAP requirements; the vehicle will be assessed without triggering ofthe active pedestrian protection elements.2.1.7The moveable bonnet top is defined as all structures connected to the bonnet that movewith the whole assembly when activated in a pedestrian impact. The rear edge of thebonnet is the most rearward point of the moveable bonnet top when it is closed2.2Detection of Pedestrians2.2.1The vehicle manufacturer must demonstrate the sensor system's ability to detect arange of pedestrian statures that result in head contacts with the bonnet. The staturesshould be selected from a 6 year old child, 5th percentile female, 50th percentile maleor 95th percentile male. A combination of physical testing and numerical simulationswill be required to demonstrate the suitability of the sensing system for the range ofpedestrian sizes.2.2.2The n umerical simulations will be required to identify the ‘hardest to detect’pedestrian and support the choice of test tool. The simulations will concern thepedestrian statures that result in head contact with the bonnet, as studied and proven inSection 2.3.2.2.3Physical testing will be used to further assess the capability of the sensing system(s).As a surrogate for a pedestrian that is larger/heavier than a 50th percentile male, thelegform detailed in Section 9 for legform to bumper tests shall be used. This is toensure that the system deploys when impacting larger or ‘upper limit’ pedestrians.2.2.3.1Justification of test tool selection2.2.3.1.1 A minimum of two numerical simulations per appropriate stature (maximum 8 in total)will be required to identify the ‘hardest to detect’ pedestrian and support the choice oftest tool. Pedestrian models should be selected from the different statures specified inSection 2.2.1.2.2.3.1.2Acceptable models and codes are detailed in Technical Bulletin TB013.2.2.3.1.3Where other numerical models are to be introduced, then the manufacturer mustprovide supporting evidence showing suitable biofidelity and kinematics of the chosenmodels.2.2.3.1.4The pedestrian stance to be used in the model will be facing in a directionperpendicular to the vehicle centreline with the legs apart walking towards the vehiclecentreline with the rearward leg being impacted by the bumper first. The heel to heeldistances (P) to be used are:6YO P = 190 ± 10 mm5th P = 245 ± 10 mm50th P = 310 ± 10 mm95th P = 337 ± 10 mmThe same simulation shall be used even if the curvature of the bumper results in thefront leg being impacted first.Note: Accident analyses performed using the GIDAS database have shown that over80% of pedestrian impacts are in crossing the road situations. This was used as thebasis for modelling the pedestrian in the lateral stance only.2.2.3.1.5The models used in the simulations will have the following H-point height aboveground when measured in upright standing position with shoes:• 95th male: 1040mm ±5%• 50th male: 938mm ±5%• 5th female: 820mm ±5%• 6YO: 610mm ±5%The tolerance values are created to capture all validated models listed in TB013based on human anthropometric data. However, 6YO data is from an old source andonly based on a single sample. As a result this data is preliminary and subject tochange in the future when more data becomes available.2.2.3.1.6The frictional value to be applied between the foot and the ground shall be between0.3±0.1.2.2.3.1.7The simulations shall be conducted at the system’s lower deployment threshold (LT)impact speed specified by the vehicle manufacturer.2.2.3.1.8The simulations will be conducted at two separate locations on the bumper. For eachof the appropriate statures simulations will be performed on the vehicle centreline andat the outboard end of the bumper test zone defined in 3.3.6. An additional simulationmay be required where the bumper test zone is relatively narrow when compared tothe width of the moveable bonnet top.2.2.3.1.9Outputs from the simulations shall clearly highlight what the critical pedestrian size isfor that particular sensing system. Once the hardest to detect pedestrian is establishedthe appropriate test tool that reflects the characteristics of that pedestrian can beidentified for use in the physical tests. The minimum output parameters from thenumerical simulations will be:• Bumper force• Effective mass• Energy• Bumper intrusion2.2.3.1.10Effective mass will be calculated as follows. This calculation assumes that peak forceon the vehicle occurs when the leg velocity reaches 0m/s:v FdtM t t e ∆=⎰21M e = Effective mass (kg) F = Force (N) Δv = Change in Velocity (m/s) dt = Time increment (s) t 1 = Time of first contact (s)t 2 = Time of peak force (s)2.2.3.1.11 In the event that a system triggers before the peak force is imparted onto the bumpercross member, the following calculation should be used:dta FdtM t t t t e ⎰⎰=2121 M e = Effective mass (kg) F = Force (N)a = Leg acceleration (m/s 2)dt = Time increment (s) t 1 = Time of first contact (s) t 2 = Time of system trigger (s)2.2.3.1.12 For the calculation of effective mass, only movement in the X direction isconsidered. The most significant structures that load the leg should be considered, such as the bumper cross member and any upper or lower cross beams. Less significant structures, such as grills and valances may be ignored. Viscous effects should be ignored.2.2.3.1.13 Of the outputs specified in Section 2.2.3.1.9, the most appropriate parameter orparameters for the specific type of sensing system will be used to show an appropriate level of correlation between the chosen test tool and the numerical simulations. The vehicle manufacturer may choose the impact location and vehicle components for inclusion onto the calculation of the output parameters.2.2.3.2 Physical testing2.2.3.2.1 To ensure that the pedestrian impact sensor(s) are effective across the full bumperwidth, a minimum of three tests shall be performed at locations within the bumper test zone.2.2.3.2.2 Test matrix:2.2.3.2.3At least test #3 shall be witnessed or performed by Euro NCAP to verify deploymentof the system at the lower threshold. Alternatively, it may be performed by themanufacturer and witnessed at their facility.2.2.3.2.4Where a test is performed below the lower threshold speed but within the velocitytolerance or outside the bumper test zone and the bonnet does not deploy, the test mustbe repeated at a speed no less than the lower threshold and not outside the bumper testzone.2.2.3.2.5The outputs from all physical tests shall include, but is not limited to:• Good quality high speed film showing an overview of the test.• Documentation of the correct test location, e.g. using paint marks and post testphotographs.• Documentation of test speed (vehicle or impactor as applicable), e.g. usingknown road markings or speed measurement systems etc.• Actuator t rigger time (current clamp/ECU).• Evidence of bonnet deployment initiation, i.e. film showin g the first movementof the bonnet top or frangible break wires/contacts/squibs.2.2.3.2.6The first physical test, or tests, must be performed with the pedestrian protectionsystem fully functional from the sensing systems to the bonnet actuators. At the sametime, it is acceptable to include an additional means of highlighting bonnetdeployment, such as flashes and/or squibs for that first test. Once valid firing time andbonnet deployment has been confirmed, the remaining tests may then be performedwith the flashes/squibs connected in place of the bonnet actuators; thus negating theneed for bonnet deployment. The entire system architecture should be present up to thebonnet actuators for all tests. Flashing hazard warning lights or other indications thatare not connected to the actuator wiring system will not be accepted.2.3Timing of Bonnet Deployment2.3.1Time independent & fully deployed devices2.3.1.1Where the manufacturer has demonstrated, by numerical simulations or alternativemeans (vehicle speed of 45km/h), that a system is fully deployed and remains in theintended position prior to the head impact time of the smallest appropriate staturepedestrian, as defined in Section 2.2.1, then all headform tests shall be performed withthe bonnet in the fully deployed position. There will be no need to trigger any activeelements during the sub system pedestrian tests.2.3.1.2Where the bonnet is shown to be fully deployed before the head impact time (HIT) ofall adult headform locations, then the dynamic adult headform tests may be replacedwith static tests. All small adult/child headform tests will then be performeddynamically.2.3.1.3The simulations shall be performed using the same CAE model/code and the samepedestrian stance detailed in Section 2.2.1 positioning the pedestrian on the vehiclecentreline.2.3.1.4Further details on performing static tests are provided in Section 8.5.2.3.2Time dependent & partially deployed devices2.3.2.1For systems that do not remain in a permanently deployed position then dynamicpedestrian testing will be required for all bonnet top test locations.2.3.2.2For systems that do not fully deploy before the HIT of all statures, then dynamicpedestrian testing will be required for all bonnet top locations.2.3.2.3The vehicle manufacturer must determine the wrap around distance for each testlocation and establish the relevant head impact time for that stature of pedestrian.2.3.2.4Further details on performing dynamic tests are provided in Section 8.5.2.4Protection at Speeds below the Deployment Threshold2.4.1Exemption zones2.4.1.1Euro NCAP maintains that bonnets which offer protection without a deployabledevice, offer protection at lower speeds and some protection at higher speeds.Therefore, Euro NCAP requires that vehicles equipped with deployable pedestrianprotection systems also provide protection at impact speeds below the systemdeployment threshold on the part of the vehicle affected by the deployable pedestrianprotection system.2.4.1.2The area of the vehicle considered will be all grid points that have a distance measuredin the lateral Y axis of 50mm or more inboard from the side reference lines and 50mmor less measured in the lateral Y axis outboard from the movable bonnet shut line. SeeFigure 1.2.4.1.3The area will also extend rearward from the 1000mm WAD up to the rear of themovable bonnet top defined in 2.1.7. Child/small adult headforms will apply to gridpoints from 1000mm to 1700mm WAD inclusive and adult headforms will apply togrid points rearward from 1700mm up to the rear of the movable bonnet top. SeeFigure 1.2.4.1.4Where parts of the movable bonnet are to be tested in the deployed position e.g. basedon head contact time, and others are not, the area of consideration will include all gridpoints that are located between the rear of the movable bonnet top and 50mm forwardor less from the most forward part of the bonnet that will be tested in the deployedposition. See Figure 1.2.4.1.5The vehicle manufacturer is required to provide the Euro NCAP Secretariat HIC15 orcolour data showing that, at the lower deployment threshold speed, no grid pointwithin the area mentioned above that is predicted green, yellow or orange at 40km/hshall produce HIC values above 1350 at the lower deployment threshold.2.4.1.6For no less than 2/3rds of the total number of grid points within the prescribed area,HIC values must not exceed 1000.2.4.1.7Data shall be provided for each grid point according to the following performancecriteria:HIC15 < 1000 = Yellow1000 < HIC15 < 1350 = Orange2.4.1.8Up to three physical tests may be performed to verify the CAE data at just below thedeployment threshold speed. These tests will be selected at random by the Euro NCAPSecretariat.2.4.1.9Where any of the criteria in Section 2.4.1.5to 2.4.1.7 are not met then all pedestriantests will be performed with the bonnet in the undeployed position.Figure 1: Area to meet low speed requirements2.5 Protection at Higher Impact Speeds2.5.1 Upper deployment threshold2.5.1.1 All deployable systems must initiate deployment at speeds of at least 50km/h. It is notnecessary for a system to be fully deployed and reach the intended position before head impact at 50km/h, but the vehicle manufacturer must show that deployment has initiated.2.5.1.2 A physical test using the impactor chosen in Section 2.2.3.1 is required at 50km/h toshow that deployment has initiated. The outputs from the test are as those described in Section 2.2.3.2.5.2.5.1.3 The test shall be performed at either the vehicle centreline or, if localised sensors used,as far away from the sensor as a possible while remaining within the bumper test zone.2.6 Bonnet Deflection due to Body Loading2.6.1 Given that deployable bonnets may have reduced support from their peripheralstructures compared to passive systems, Euro NCAP requires that head protection is not compromised by bonnet collapse.2.6.1.1 This is done by measuring and comparing the Z displacement at the position of headcontact for both a deployed and undeployed bonnet at the time of first head contact. At the position of head impact the difference between deployed and undeployed bonnet can be no more than 75% of the generated deployment height at that point, see Figure2. 2.6.1.2 The evaluation shall be calculated with the use of CAE without the ‘package’ beingpresent. The package meaning engine and ancillaries. All body in white structures and bonnet supports must be present. However, all components that load the legs and pelvis must be included.2.6.1.3 At the point of head impact it is essential that the bonnet deflection in the deployed state does not exceed the total available clearance between deployed bonnet and under bonnet hard point, i.e. (h2 + h3) - z2 > 0, see Figure3.2.6.1.4 This would be established using numerical simulations at 40km/h with the appropriate sized pedestrian that loads the least supported part of the bonnet top for that particular size of vehicle. For example, on a small vehicle with a short bonnet it may be that the 50th percentile male contacts the vehicle rearward of the bonnet top. Therefore, a smaller pedestrian stature will be required.2.6.1.5The stance described in Section 2.2.3.1.4 shall be used positioning the pedestrian’s head on the vehicle centreline.Note: Impacts at the centreline were chosen to simplify to the modelling needed and to avoid the possibility of glancing blows. It is also assumed there will be the least support to the bonnet at the centreline.Figure 2: Bonnet deflection deployed and undeployed comparison(1) Undeployed simulation: 40km/h, centreline, walking posture, 50th % (if no bonnet contact 5th %)(1)Z displacement at head contact point: z(1)at first time of head contactExample: h(2)=100mm (2) Deployed simulation: 40km/h, centreline, walking posture, 50th % (if no bonnet contact 5th %)(2)Z displacement: z(2)(3)Deployment height: h(2)(3) RequirementZ(2) -Z(1) < 75% * h(2)Example:75mm –50mm < 75% * 100mm25mm < 75mm (=OK)Bonnet deflection in the deployed state (z(2)) must not exceed bonnet deflection in the undeployed state (z(1)) by more than 75% of the deployment height (h(2))Figure 3: Bonnet deflection total clearance requirement3VEHICLE MARKING3.1 General3.1.1The vehicle shall be marked with a grid as described in the following sections. Themarking procedures divide the front and bonnet of the car into zones which are thenassessed using appropriate impactors.3.1.2Where no predicted data is to be provided by the vehicle manufacturer, the testablearea shall be marked as described in the Euro NCAP Pedestrian Testing Protocolversion 5.3.1, November 2011.3.1.3All markings and measurements should be made with the vehicle in its Normal RideAttitude.3.1.4The vehicle manufacturer must provide Euro NCAP with coordinates of all grid pointsderived from either CAE data or physical mark out.3.1.5 A comparison of the grid origin C0,0 and two other points on 2100WAD, will bemade between the laboratory mark out and the data provided by the vehiclemanufacturer. For manufacturer data to be accepted, grid points must be within 10mmof each other.3.1.6Where the grid points of Euro NCAP and vehicle manufacturer are within 10mm ofeach other the laboratory mark-out shall be used.3.1.7Where the two grids differ by more than 10mm the vehicle manufacturer shall beinformed and both markings will be examined in greater detail to establish the cause ofany differences. The Secretariat will then take a decision as to how to proceed withvehicle marking.3.1.8The vehicle manufacturer must provide data for all headform grid locations. Testingwill be carried out by Euro NCAP to a number of locations to verify the accuracy ofdata provided by the vehicle manufacturer.3.1.9For vehicles fitted with active bonnets, the headform impactor marking will be appliedto the vehicle with the bonnet in the undeployed state. This will be the case regardlessof whether or not the bonnet is locking or non-locking.3.1.10For vehicles fitted with active bonnets, the bonnet leading edge line will be marked onthe vehicle with the bonnet in the un-deployed state. If bonnet deployment occurs priorto the pedestrian contact with the bonnet leading edge (BLE), creating an increasedhazard such as higher BLE height and/or bumper lead, the Euro NCAP secretariat willgive consideration to marking out the BLE in the deployed state.Note: Marking in the undeployed state was chosen to avoid the possibility ofdiscontinuities in the test areas leading to anomalies or inconsistencies in the testresults.3.1.11Where the vehicle manufacturer provides data showing that a deployable bonnetsystem offers protection to the upper leg, the upper legform to BLE tests will becarried out by conducting dynamic tests. The BLE will be marked on the vehicle in thedeployed position.3.2Bumper Reference LinesFor vehicles with an identifiable bumper structure the upper Bumper Reference Line is defined as the geometric trace of the upper most points of contact between a straight edge and the bumper, when the straight edge, held parallel to the vertical longitudinal plane of the car and inclined rewards by 20 degrees, is traversed across the front of the car whilst maintaining contact with the upper edge of the bumper. For a vehicle with no identifiable bumper structure it is defined as the geometric trace of the upper most points of contact between a straight edge 700 mm long and the bumper, when the straight edge, held parallel to the vertical longitudinal plane。
基于GT-POWER7.0的消声器建模与分析步骤研究报告南京林业大学汽车与交通工程学院二〇一二年八月消声器相关尺寸如图:消声器二维结构图图示抗性消声器有四个腔,四腔的长度分别为205mm,73mm,175mm,185mm,在第一腔和第四腔的消声器管上分别有100个5mm的孔和320个3.5mm的孔,每个隔板上都有8个周布的20mm的孔,消声器管的长度为747mm,消声器壳体厚度为2mm,管的厚度为1.2mm,消声器壁厚为1.5mm。
以下将运用GT-Power7.0软件对此消声器进行建模及性能仿真分析。
一、消声器建模1.建立消声器壳体启动软件,选择GEM3D v7.0.0以建立消声器的三维模型。
File——New——Save as 输入文件名“818newmuffler”——确定,如下图。
点击工具栏上的图标“”,弹出如下对话框。
在object处输入壳体名“shell”,在wall Thickness 处输入壳体壁厚1.5mm,如下图。
点击下方的“cross Sections”,在“cross section Name”处输入截面名称“shellcircle”,在“Distance to Next Cross Section”处输出消声器壳体长度。
如下图。
双击绿色的截面名称“shellcircle”,编辑消声器的截面。
选择CSCircle点OK,有下图。
输入壳体外圆直径180mm,点击OK。
至此,消声器壳体定义完毕,如图。
2.建立直通管在工具栏上点击“”,弹出如下对话框,输入管件名称“muffpipe1”,进口管直径和出口管直径,此处均为54,管件长度747,管件壁厚1.2,如下图。
点击“Location”,确定管的摆放位置。
根据坐标轴的指向,在Z方向输入-84,指出直通管的起始位置,如下图。
点击OK,至此直通管建立完毕,如下图。
3.直通管穿孔在工具栏上点击“”,弹出一对话框,输入孔径5,孔的个数100,打孔位置距离参照位置的距离16以及打孔区域长度90。
一.reference翻译reference 基本解释reference在线翻译名词参考; 参考书; 提及,涉及; 证明人,介绍人动词引用; 参照reference 相关词组1. without reference to : 不论, 与...无关;reference的解释reference 相关例句名词1. The boss didn't make any reference to his former employer.老板没有提及他以前的雇主。
2. References are given in full at the end of this article.本文末尾处有全部的参考书目。
3. When I was looking for a job, I asked my head teacher to give me a reference. 当我在找工作时,我向我的班主任要一份关于我情况的证明。
4. That is a matter outside the reference.那是委托权限之外的事情。
reference 情景对话假期B:Can I check this (book/ encyclopedia/ audiotape) out?这(本书/本百科全书/块录音磁带)我可以借出吗?reference的近义词A:I’m sorry. It’s for reference only.对不起,这是只供参考的书目。
Borrow books-(借书)A:Can I help you?我能为您效劳吗?B:Yes, I’m doing some research on Roman civilization. Do you have any books on the subject?我在做一些关于罗马文明方面的研究,这方面有没有什么书?A:These books over here are about ancient history. They might be helpful.这里的这些书是关于古代历史的。
1.进入Endnote7.0,从“Tools”菜单下点击“Connect”2.出现“Choose A Connection File”对话框,选定数据库,点击“Connect”3.按照布尔逻辑设定搜索词,点击“Search”4.出现搜索结果,存入指定的文献库提示:1.通过点击“Find” 进行查找设置可以提高对某一类型数据库的查找效率2.很多数据库需要输入帐号和密码3.“ Save Search”可以保存搜索设置;“Load Search”可以导入已保存的搜索设置;“Add Field” 和“Delete Field”分别添加和删除设置栏功能二管理库内文献一、导出文献EndNote库内的文献可以以4种格式导出:Rich Text Format (RTF), HTML, XML, 和 plain text documents(TXT)。
从而创建独立的文献集或者创建可以导入到其他数据库的参考文献。
导出的文献样式由当前样式决定,当前样式可以从“Edit”菜单下的“Output Styles”或者工具栏上的样式下拉框选定。
导出步骤:1.选定要导出的文献库2.按照自己的要求排列文献的顺序3.选择合适的文献样式4.从“File”菜单下点选“Export”.6.出现导出对话框,选择要保存的文件格式.rtf; .html; .XML; .txt 和文件名7.保存注意: 如果文献库内有图像的话,图像将不会随之导出。
只能另外粘贴。
二、导入文献EndNote可以将不同来源的文献导入到已存在的库内或新建的库中:A.Online searching:即通过EndNote直接进入网上数据库查找和获得文献B.Direct Export:很多网络数据库如MEDLINE、Pubmed、CSA等都支持将自己选择的文献以EndNote可识别的格式下载C.CD-ROM:将CD内的文献转换为文本格式以后通过滤镜导入滤镜:滤镜用于导入网络数据库、CD-ROM和任何含有能够说明文件内信息的标签的文本文档。
7.0 References[ALPHA92] Alpha architecture reference manual. Sites, R.L. (Ed.), Digital Press, Burlington, MA. 1992. [AMR94] Amir, E., McCanne, S., Razavi, H. Performance impacts of architectural optimizations for soft-ware video codecs. CS252 class report, Dec. 1994.[CACM91] Communications of the ACM, April 1991. Special Issue on Digital Multimedia Systems, 34(4).[DWA*] Dobberpuhl, et al. A 200 MHz 64-bit dual-issue CMOS microprocessor. Digital Technical Jour-nal, V ol. 4(4), Special Issue 1992.[GAL91] Gall, D. MPEG: A video compression standard for multimedia applications. CACM 34(4). April 1991, pp. 46-63.[GKM82] Graham, S., Kessler, P., McKusick, M. Gprof: A call-graph execution profiler. In Proc. SIG-PLAN 82 Symp. on Compiler Construction. SIGPLAN Notices, 17(6), pp. 120-126, June 1982.[HILL89] Hill, M.D. Test driving your next cache. Magazine of Intelligent Personal Systems (MIPS), Aug. 1989, pp. 84-92.[HP] The PA-RISC 1.1 Architecture Reference Manual. Available on /nsa/acd.html. [PSR93] Patel, K., Smith, B.C., Rowe, L.A. Performance of a software MPEG video decoder. In Proc. ACM Multimedia 93, pp. 75-82.[SPEC] Benchmarking 2: SPEC: System Performance Evaluation Cooperative. Capacity Management Review, 21(8), Aug 1993.[V AR93] Varley, D.A. Practical experiences of the limitations of gprof. Software - Practice and Experi-ence, April 93, 23(4).[WAL91] Wallace, G.K. The JPEG still picture compression standard. CACM 34(4), April 1991, pp. 30-44.5.0 Conclusions and Future WorkOur contributions in this paper are two-fold: first, we described a set of six multimedia programs that constitute a benchmark suite and justified the inclusion of these programs on the basis of their being standards and their popularity in the field. We then presented the results of running these programs on four different hardware platforms -- a DEC 5000/240, an HP 9000/730, a DEC Alpha 3000/400, and a SPARC-Station 20/51 (measurements on a Pentium 90-based PC are in progress). Our results show that in general, integer performance as approximated by SPECInt92 is not a good predictor of multimedia performance. On the DEC 5000/240 and HP 9000/730, SPECInt ratings seem to predict multimedia performance quite well, but this is far from true for the newer, superscalar architectures like the Alpha and the Sparc 20. W e performed several cache simulations and found highly variable miss rates from less than 1% to 20% depending on the program for an 8KB cache. However, we also found that cache behavior did not ade-quately explain observed performance, and measured the performance of a few microbenchmarks. These showed that the primary reason for poor performance on the Alpha was load delay stalls even when the data was present in the cache. On the Sparc, the reasons were poor branch performance, as well as software integer multiplication (this was the default option chosen by the compiler; later measurements for 2 of the programs with an option to use the hardware instruction showed performance improvements between 5 and 10%). Finally, one of the programs (MPEG encoding with high quality) showed extremely good per-formance (118% of SPECInt) because of aggressive use of superscalar instructions and conditional moves rather than branches.Based on these results an experience with the Alpha and Sparc 20 architectures, we conclude that it is much harder to predict the performance of general programs on the newer, superscalar architectures. In addition, the promise of high performance isn’t always achieved, since high clock rates may have to be traded off for load delay slots (like for the Alpha), and this could mean delays even on cache hits. This also implies that traditional methods of cache simulations are not sufficient to completely explain the memory-system performance of programs on such architectures since the access time on a cache hit doesn’t always remain constant.6.0 AcknowledgmentsWe thank Srinivasan Seshan, Dave Patterson, and Remzi Arpaci for several useful discussions and for comments on earlier drafts of this paper.Table4 and 5 show the percentages of time spent by the two programs in different functions on the Sparc20 and Alpha respectively. In each case, the top number in any cell gives the percentage of time spent in the function and the lower number the relative performance based on our microbenchmarks. The last column has our predicted performance (pre) and the observed performance (obs). For the Sparc the pre-dicted performance of both programs is fairly close to the observed one. The reason MPEGHIGH is pre-dicted better than MPEGLOW is because the former has a much lower cache miss rate. On the Alpha, the prediction for MPEGHIGH is within 10% of the observed performance, but the prediction for MPEGLOW is far from the observed one. The cache miss rate is only about 2.6%, and is not significant enough to cover this difference. However, we feel that our microbenchmark approach to explaining performance is by and large correct in predicting performance to within 10 or 15% in most cases.Finally, an interesting observation is the extremely good performance of ENCODE-HIGH on the Alpha. We profiled the program and found that more than 90% of the total execution time was spent in one function. This function contained a small computation (one addition and one absolute value computation) inside a loop that had been unrolled manually in the C code to get better performance. From the assembly listing of that function we discovered that the compiler was able to fill the load delay slot with two inde-pendent instructions (that often executed in parallel on the superscalar architecture) and used the condi-tional move instruction to compute the absolute value (rather than a more conventional branch). This resulted in very good performance on this machine (118% of the SPECInt performance). However, the assembly listing of the same code on SPARC20 had branches to compute the absolute value, resulting in relatively poor performance.critical loop. ALPHA has a 2 cycle delay slot, which is the reason it performs so badly on LOADSTORE. Even two successive loads operating on independent data requires one intervening delay slot. All the other machines scale according to SPECInt92.ALPHA doesn’t perform well on LD+SW+BR benchmark. Its relative performance is only 1.53. The assembly code of this benchmark consists of two dependent load instructions and a store instruction as in the LOADSTORE benchmark, followed by add, shift, compare and branch instructions. Each instruc-tion depends on the result of the previous instruction. The superscalar design of ALPHA doesn’t help in speeding up this program as the instructions show high dependency. HP730’s performance scales well as predicted by SPECInt92, whereas SPARC20’s performance is only 1.84 as opposed to the predicted value of 2.64. The reason for this is that the program is unable to efficiently utilize the SPARC20’s superscalar design; in addition, the branch performance of the Sparc20 is a little poor.The assembly listing of the BRANCH program in very similar to that of LD+SW+BR program except that in the two dependent loads and one store are absent in the loop. We see that relative perfor-mance of ALPHA is better as compared to LD+SW+BR. Since the dependent load and store instructions are absent in this benchmark, the performance of ALPHA is slightly better because now the processor doesn’t have to stall for one or two load delay cycles. HP730’s performance scales as expected, but the SPARC20’s performance is bad on this benchmark. The processor may have a poor branch prediction scheme, or it might just be the case that for this particular program the branch prediction scheme doesn’t work well.We can explain the performance of these programs on the basis of these microbenchmarks. W e see that three of the four microbenchmarks for MEPGLOW perform badly on ALPHA explaining why MPE-GLOW doesn’t perform very well on ALPHA. On the HP 730, three of these benchmarks have perfor-mance as predicted by SPECINT92 and one of them performs better than SPECINT92 (there isn’t as much exploitation of the multiplication pipeline possible in MPEGLOW as in the microbenchmark modeling multiplication). The net result is that the performance of MPEGLOW is very close to the SPECINT92 per-formance on the HP machine. On SPARC20 all the microbenchmarks have relatively poor performance. The MULT benchmark has the worst performance of 0.79 whereas SPECINT92 has a performance of 2.64. This can explain the poor performance of SP ARC20 on MPEGLOW program.We can quantitatively explain the performance of most of the programs on the Alpha and Sparc20. In this section, we show these calculations for both MPEG programs on these machines.•Integer multiplication: Computing the reverse discrete cosine transform (RDCT) is another majortime consuming operation. On the Alpha, 21% of the time was spent in this function on MPEGLOW.This percentage was much higher (44%) on the DEC 5000/240 that has a much slower CPU. Integer multiplication is an important component of this function. The code uses a macro which typecasts its operands (if possible) to 16 bit numbers before the multiplication. This is done to make the multiply go as fast as possible. The microbenchmark MULT measures integer multiply performance.Figure 5 shows the relative performance of these microbenchmarks. From the figure we see thatperformance of the Alpha on MULT scales as predicted by the SPECINT92. HP 730 has extremely good performance on MULT whereas Sparc20’s performance is very poor. On the Sparc20, we used standard compiler options to gcc (-O4 -funroll-loops ), and this defaults to the software multiply routine which in turn results in poor performance of the system on RDCT. We modified the program to have fewer multiply instructions in the loop and found that the relative performance of the modified program was worse. The HP730 has a pipelined integer multiply unit, and this was evident in the increasing relative performance as the number of successive multiply operations in the loop increases (until the depth of the pipeline).From Figure 5, we find that the relative performance of the Alpha on LOADSTORE is 1.51 (nor-malized with respect to the DEC 5000/240), whereas according to SPECInt92 it should be 2.68. The assembly code for this microbenchmark has two dependent loads in succession followed by a store in the12345SPECINT 92MULTIPLY LOADSTOREBR+LD+SW BRANCHDEC 5240ALPHAHP 730SPARC 20FIGURE 5. Relative performance of microbenchmarks vs. SPECInt performancethe machines. In the remainder of this section, we describe these microbenchmarks, and then present the results of running them on our different machines.•Branches, loads and stores: On the Alpha and Sparc, a significant portion of the execution time (25%)for the program MPEGLOW is spent in a function that checks if the decoded values of the coefficients are within range (if there is an error in the encoding of certain types of frames, the assertion fails). This code has a loop containing a series of array assignments (loads and stores) with several assert() state-ments (that compile to branch instructions). This portion of the code was extracted to get the microbenchmark BR+LD+SW.•Branch performance: In order to evaluate the branch performance on the various architectures weremoved the memory accesses from the BR+LD+SW benchmark. The remaining code had only assert statements. This is a common and time-consuming part of all our programs. W e call this microbench-mark BRANCH.•Loads and stores: Low quality (gray) dithering is another time-consuming operation in MPEGLOWon the Alpha and the Sparc. The code consists of a series of table lookups (array assignments, loads and stores) in a manually unrolled loop with a small number of integer additions. W e based the LOAD-STORE microbenchmark on the basis of this function. In general, this models the performance on loads and stores (e.g, array copying) for any machine.R e l a t i v e P e r f o r m a n c eMiss rate (%)FIGURE 4. Scatter plot showing performance vs. L1 cache miss rates on the Alpha and Sparc for three multimedia programs and SPECInt. The miss rates for MPEG programs are less than for SPECInt, but so is their performance!!size. However, this is in the absence of any write buffers, and in reality the miss rates are likely to be about the same as in the write-back case.For MPEGHIGH and MPEGLOW, the miss rates were quite low for all sizes. Even for a smallcache size of 8 KB, the miss rate for MPEGLOW is only about 2.6%. Figure 4 is a scatter plot that shows the miss rates for these three programs and the SPEC programs on the Alpha and the Sparc. The miss rates for the MPEG programs on both machines are less than those for the SPEC programs. Y et, the relative per-formance for the SPEC programs is much better ! This means that these cache simulations don’t fully explain the reason for the degraded performance for these programs on the Alpha and Sparc. In the next section, we describe a few microbenchmarks on the basis of which we explain the performance of these programs.4.2 MicrobenchmarksSince the cache simulations don’t adequately explain observed performance, we decided to take acloser look at the profile information and run a few microbenchmarks to explain these results. W e profiled the programs showing most deviation from their rated SPECInt values and wrote microbenchmarks similar to the critical code of these programs. We then measured the performance of these microbenchmarks on all51015208163264128256M i s s r a t e (%)Cache size (KB)"MPEGHIGH""MPEGLOW""DJPEG"FIGURE 3. Miss rates vs. Cache Size (log scale) for 3 multimedia programs.The cache has a block size of 32 bytes and is direct-mapped.DEC Alpha and the SPARCStation 20/51. In other words, for these programs, it seemed like the newer, superscalar architectures with two-level caches and superior memory systems and processors were doing worse than expected.. And as a final twist, the performance for ENCODE-HIGH (high-quality encoding of MPEG frames) on the Alpha was 18%better than that predicted by SPECInt!In the remainder of this section, we explain these results using a couple of different techniques: cache simulations and microbenchmarks. It is often the case that the performance of the memory system has a lot to do with the performance of a program. This is especially true in our situation since we have excluded I/O activity and are trying to explain the performance of the remainder. One of the important methods of testing this is by measuring the cache performance of the program with the relevant cache parameters, and computing the miss rate and miss penalty, and by determining the average memory access time for the program. The next section describes the results of the cache simulations of these programs for different cache sizes and parameters.4.1 Cache SimulationsWe carried out cache simulations of three programs that showed high deviation in behavior from SPECInt -- MPEGHIGH, MPEGLOW, and DJPEG. We used pixie[PIX91] to generate memory access traces for these programs from the runs on the DEC 5000/240. Ideally, we would have liked to use memory traces generated on the Alpha, but the version of pixie on the Alphas available to us didn’t produce full memory traces. We then used dinero [HILL89] to perform the cache simulations for a whole range of cache sizes. We performed these simulations using two different input data sets (video clips of different sizes) for MPEG, and did not find big differences in the miss rates. The Alpha and Sparc have two-level caches with a large second-level cache (512 KB and 1 MB respectively). For these machines, we did two-level cache simulations with the appropriate cache parameters. The miss rates for the second-level caches were very low, with virtually all the misses being compulsory misses. In addition to finding the miss rates on our machines, we also did the simulations for a range of cache sizes (for a one-level cache). In these simulations, all the parameters except the cache size were held fixed (block size of 32 bytes, direct-mapped and random replacement). The results of these simulations are shown in Figure 3.For DJPEG the cache miss rates vary from less than 1% (256 KB) to 20% (8 KB). However, the performance of DJPEG on the Alpha and Sparc are explained only in part by these cache simulations. These cache simulations are for a write-back, direct-mapped cache. This is true for the Sparc, but not for the Alpha, which has an 8KB write-through cache with write buffers. When we did the same simulations for a write-through cache without write buffers, we obtained a miss rate of about 29% for an 8KB cacheMPEGHIGH. We also note that for the Alpha and Sparc 20, the performance of most of the programs is lower than that predicted by SPECInt.Another informative way of interpreting the performance of these programs on the different plat-forms is shown in Figure 2. This figure groups together the relative performance for the same program on different machines. For four of the programs -- MPEGHIGH, MPEGLOW, DJPEG and CJPEG, the perfor-mance order is SPARC 20 > HP 730 > ALPHA 3400 > DEC 5240, while the Alpha performs well only on the MPEG encode programs.In the next section, we discuss the results of several cache simulations and microbenchmarks andexamine the reasons for these results.4.0 Cache Simulations, Microbenchmarks, and ExplanationsIn this section, we explain the reasons for the observed performance on the different platforms.Since all these multimedia programs have no floating point operations, we expected SPECInt performance to be a good predictor of multimedia performance. What we found was that while this hypothesis was fairly accurate (to within 10%) for the DEC 5000/240 and the HP 9000/730, this was far from true for the0.511.522.533.5HP 730ALPHADEC 5240SPARCHIGH LOW HIGHLOWFIGURE 2. Comparative performance of multimedia programs and SPECInt groupedprogram-wise to highlight differences between different architectures.0.511.522.533.5SPECINT 92 MPEGHIGH MPEGLOW ENCODE-HIGH ENCODE-LOW CJPEG DJPEGDEC 5240ALPHA HP 730SPARC 200.511.522.533.5SPECINT 92 MPEGHIGH MPEGLOW ENCODE-HIGH ENCODE-LOW CJPEG DJPEGDEC 5240ALPHAHP 730SPARC 20FIGURE 1. Relative performance of the 6 different multimedia programs andSPECInt92 normalized with respect to the DEC 5000/240.(a) Relative performance based on overall elapsed times(b) Relative performance excluding I/O (disk/display)3.0 Experimental ResultsWe ran these benchmarks on four different platforms: a DEC Alpha 3000/400, a SPARCStation 20/51, an HP 9000/730 and a DEC Station 5000/240. Measurements on a Pentium 90-based PC are in progress. This section describes the results we obtained and compares multimedia performance with rated SPECInt performance.The first set of results, using overall elapsed time as a metric, is shown in Figure1(a). This figure shows performance normalized with respect to the DEC 5240. As we can see, SPECInt performance on the HP 730 and the DEC 5000/240 is a good predictor of multimedia performance, but this is far from true for the DEC Alpha and the Sparc 20.One reason for the lack of scaling with SPECInt performance could be the time spent in I/O activ-ity.SPECInt is a measure of the CPU performance, whereas I/O performance is an important component of these multimedia applications. We timed the functions involving I/O activity and calculated the fraction of the time these programs spend doing I/O. The results are summarized in Table3.For MPEGLOW, thefraction of total time spent in I/O varies from 18.62% to 43.53%; for ENCODE-HIGH the I/O activity is relatively unimportant, since the fraction of time spent in I/O varies only between 0.91% and 3.67%.Since SPECInt doesn’t reflect the I/O performance of the computer systems, the total execution time of the programs may be very different from that predicted by SPECInt. We subtracted the I/O times from the total execution time of the programs to compute their CPU times. Figure1(b) compares the rela-tive performance of these programs excluding I/O time. W e again see that the performance of HP 730 scales as predicted by SPECInt whereas the performance of the Alpha and Sparc 20 are different for differ-ent programs and show little correlation with SPECInt. The Alpha performs fastest on ENCODE-HIGH and slowest on MPEGLOW. Sparc 20 has poorest performance of ENCODE-LOW and best onfocus on architectural differences, we standardized the compiler and optimization options; in all experi-ments, we used the GNU C compiler (gcc) at its best machine-independent optimization level (-O4 and-funroll-loops). Our goal was to focus on architectural differences and their impact on performance and we didn’t want to be confused by spurious differences in performance introduced by differences in compiler optimizations. In order to measure elapsed times, we used accurate timers on all the systems: we used cycle counters accurate to one clock cycle on the Alpha and the HP 730, that introduced overheads of the order of only a very small number of instructions, while on the DEC 5240 and the Sparc, we used high res-olution timers (of the order of a few microseconds, at most) with a system call (gettimeofday()) interface.We started with the idea of doing accurate profiling of programs using a tool like prof or gprof [GKR82]. However, preliminary results quickly convinced us of the unreliability and inadequacy of these tools for our purposes. Such experiences are also reported in [V AR93]. The main reasons for this are:•I/O (disk and display) time: Most profiling tools work by sampling the program counter at regular inter-vals (typically once every clock tick, usually 60 times a second) and extrapolating the results of these samples over the run time of a program to produce the profile information. However, when a process is blocked waiting for an I/O action to complete, it relinquishes possession of the CPU, which means that these times are not measured by such sampling-based methods. As we will see in Section 3, there is sig-nificant I/O activity in many of our programs, and therefore profiling tools are inappropriate for com-pletely measuring these programs.•Short runs: For many inputs, several of our programs finish executing in just a few seconds. Sampling-based statistical tools are accurate only if the run-time of the profiled program is sufficiently long.We did, however, use gprof to get a broad idea of where each program spends most of its time, and instrumented those functions using accurate timers. On the DEC Alpha, we used a process cycle counter, accurate to the granularity of a clock cycle (7.5ns in our system). The cycle counter is a 32-bit register that is updated every clock cycle and can be read in one instruction [ALPHA]. Such an instruction is present in HP’s PA-RISC architecture too, where it is called an interval timer[HP]. This register can also be read in one instruction. On the Sparc 20 and the DEC 5240, we used high resolution timers accurate to a few microseconds, with a system call interface (a high resolution gettimeofday() call). Overall, we found these timers much more accurate and reliable than profilers, and feel that future architectures would do well to include such tools to encourage and facilitate better performance studies.pressed form involves computing the inverse operations (forward DCT). Detailed explanations of these techniques can be found in [GAL91].2.2 The Benchmark ProgramsArmed with the above description of what constitutes multimedia software, we decided to choose the following six programs to measure and study on our platforms. A summary of these programs is shown in Table2We focused on programs that were common and standardized, rather than on more recent software with possibly better algorithms, since these standard ones are the most commonly used. W e measured the performance of both decoding and encoding of video frames. MPEGHIGH and MPEGLOW are the Ber-keley MPEG player with very different playback qualities, and show very different program behavior. This is true for the corresponding encoding programs as well. One weakness of this set of programs is the bias towards video-based software, and no emphasis on hypermedia applications such as Mosaic. This was mainly because of lack of time; we intend to study the architectural performance and needs of such pro-grams in the future.2.3 Benchmarking Techniques and ToolsWe now describe the way in which we measured the performance of the above programs and the tools we used. We repeated the experiment several times for each program on many different data files to cover the entire spectrum of available frame sizes, encoding, and other relevant parameters. Overall elapsed time was the metric we used as the measure of performance since that is the most unambiguous and precise measure of the performance of a program.. T o standardize our operating environment andinferior branch performance coupled with software integer multiplication1 (on the Sparc). We substantiate these claims by a few microbenchmarks that mirror the critical loops performed in these programs.The rest of this paper is organized as follows. In Section 2, we present the benchmark suite and discuss our benchmarking methodology. We present the details of our experimental results in Section 3, and explain observed performance on the basis of a few microbenchmarks in Section 4. This section also has the results of several cache simulations of these programs. W e conclude in Section 5 with suggestions for future work.2.0 Benchmarks and MethodologyIn this section, we describe the different programs we studied and the benchmarking methodology we used. Before doing so, we define what we mean by a multimedia program, since this is essential to understanding why we measured the programs we did.2.1 What is Multimedia?Recent advances in computer technology have resulted in a new class of applications called multi-media applications. Video conferencing, video on demand and hypermedia (such as Mosaic) [CACM91] are examples of such applications. In all these applications, processing of digital video is a very important component and this imposes demanding requirements on computer systems. For example, NTSC quality video with 480x640 dots per frame, transmitted at a rate of 30 frames per second, requires the ability to process 9.2 million pixels per second. The video is almost always compressed before its storage and trans-mission and is uncompressed while being displayed. The common operations on video data include com-pression, decompression, display and transmission and they stress all components of a computer system --the CPU, the memory system, and the I/O system (consisting of both the disks and the display).There are several algorithms for compressing video, the most popular one is called MPEG (Motion Picture Experts Group) [GAL91] and is being proposed as a standard. Similarly, JPEG (Joint Pho-tograph Experts Group) [W AL91] is a commonly used algorithm and standard for compressing still pic-tures. Most video playback algorithms involve computing the reverse discrete cosine transform (RDCT), which is a CPU-intensive operation that involves integer additions and multiplications and a CPU- and memory-intensive operation called dithering[AMR94]. Similarly, the encoding of video images into com-1. This is with the standard compiler options that we used on all the platforms with gcc. With the -mv8 option, gcc compiles using the hardware multiply instruction.。