48 Survey Results
- 格式:doc
- 大小:46.50 KB
- 文档页数:4
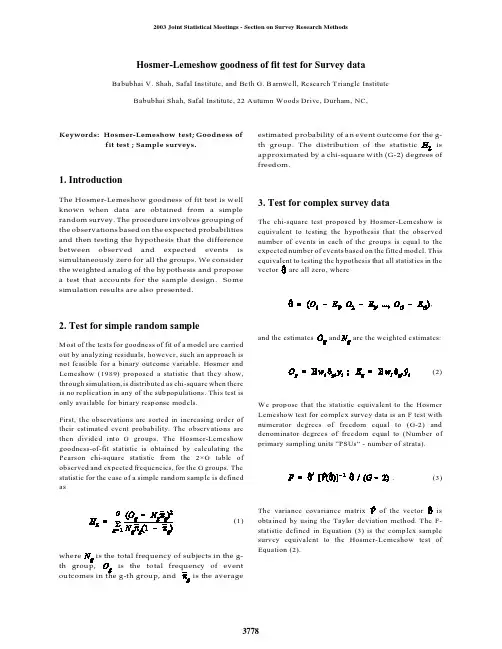
Hosmer-Lemeshow goodness of fit test for Survey data Babubhai V. Shah, Safal Institute, and Beth G. B arnwell, Research Triangle Institute Babubhai Shah, Safal Institute, 22 Autumn Woods Drive, Durham, NC,Keywords: Hosmer-Lemeshow test; Goodness offit test ; Sample surveys.1. IntroductionThe Hosmer-Lemeshow goodness of fit test is w ellknown when data are obtained from a simplerandom survey. The procedure involves grouping ofthe observations based on the expected probabilitiesand then testing the hypothesis that the differencebetween observed and expected events issimultaneously zero for all the groups. We considerthe weighted analog of the hypothesis and proposea test that accounts for the sample design. S omesimulation results are also presented.2. Test for simple random sampleMost of the tests for goodness of fit of a model are carriedout by analyzing residuals, however, such an approach isnot feasible for a binary outcome variable. Hosmer andLemeshow (1989) proposed a statistic that they show,through simulation, is distributed as chi-square when thereis no replication in any of the subpopulations. This test isonly available for binary response models.First, the observations are sorted in increasing order oftheir estimated event probability. The observations arethen divided into G groups. The Hosmer-Lemeshowgoodness-of-fit statistic is obtained by calculating thePearson chi-square statistic from the 2×G table ofobserved and expected frequencies, for the G groups. Thestatistic for the case of a simple random sample is definedas(1)whereestimated probability of an event outcome for the g-freedom.3. Test for complex survey dataThe chi-square test proposed by Hosmer-Lemeshow isequivalent to testing the hypothesis that the observednumber of events in each of the groups is equal to theexpected number of events based on the fitted model. Thisvectorand the estimates(2)We propose that the statistic equivalent to the HosmerLemeshow test for complex survey data is an F test withnumerator degrees of freedom equal to (G-2) anddenominator degrees of freedom equal to (Number ofprimary sampling units “PSUs” - number of strata).(3)The variance covariance matrixobtained by using the Taylor deviation method. The F-statistic defined in Equation (3) is the complex samplesurvey equivalent to the Hosmer-Lemeshow test ofEquation (2).4. Taylor deviations(4)and applying the method described in Shah(2002):(5)5.Simulation Results .It is not possible to evaluate the methods analytically, so we have used simulation. The data were derived from large national survey with 48 strata with four PSUs in each stratum. Three independent variables were selected from a large national survey. For each observation, the value for the binary dependent variable was randomlygenerated with probability based on the logistic model:where the linear function f was:For the generated dependent variable, the logistic model is known to be a good fit, that is, the null hypothesis is true. Hence, the percentiles of the computed P=values for the test of goodness of fit should be close to the percentile values. Since, two of the dependent variables had only a few distinct vales, they may be treated as categorical. We fitted the model two ways:•By treating two of the independent variables as categorical in the first model•By treating all independent variables as continuous in the second modelWe drew one hundred thousand samples as simple random samples, and applied the methods for a simple random sample. The results for both models are presented in Tables I and II.We also selected one hundred thousand samples, after selecting two PSU’s from each stratum with probability proportional to size, and then selected a varying number of units with equal probability within a PSU. The results for these samples are presented in T ables III and IV..For each of the generated samples, we computed a P-value by the each of the methods and the rank of the model. The table presents the percentile for the P-values.We also computed P-values using Wald F and the Satterthwaite adjusted F statistic for the stratified clustered samples (Table III and IV).It should be noted that the Wald F and Satterthwaite adjusted F are identical for the case of a simple random sample and hence only one of them is presented in Tables I and II..6. Conclusions.From Table I, For the case of the model with two categorical variables and simple random samples, results obtained by the method based on Taylor deviations is better than those based on the original Hosmer Lemeshow method. The results in Table II for the model with all continuous variables are similar.For the case of a stratified clustered sample with unequal probabilities, the tests based on W ald F and. Satterthwaite adjusted F statistics seem to provide lower and upper bounds for the “true” confidence level. The Homer Lemeshow produces results that are poor in the tail of the distribution, which is critical for a test of hypothesis. The results are preliminary, because they are based on one data set, and only two models. Further simulations are needed to confirm the finding that Taylor linearization based tests are appropriate for a variety of sample designs and different models.ReferencesBinder, D. A. (1983). "On the Variances of Asymptotically Normal Estimators from Complex Surveys," International Statistical Review, 51, 279-292.Hosmer, D. W. and Lemeshow S. (1989). Applied Logistic Regression. New York: John Wiley & Sons, Inc.Shah, B. V. (2002) “Calculus of Taylor Deviations” paper presented at the Joint Statistical Meetings.Appendix: Taylor deviations for Logistic RegressionFor logistic regression, the assumptions are:andHenceandare:(6)(7)(8)(9)observation (rtsu) is(10)(11)On substituting the partial derivative of beta fromEquation (8), in Equation (11) the result is:(12)Equation (12) provides the Taylor deviationneeded for calculation of Taylor deviations offor computing variance covariance matrixrequired in Equation (3).Below is given annual work summary, do not need friends can download after editor deleted Welcome to visit againXXXX annual work summaryDear every leader, colleagues:Look back end of XXXX, XXXX years of work, have the joy of success in your work, have a collaboration with colleagues, working hard, also have disappointed when encountered difficulties and setbacks. Imperceptible in tense and orderly to be over a year, a year, under the loving care and guidance of the leadership of the company, under the support and help of colleagues, through their own efforts, various aspects have made certain progress, better to complete the job. For better work, sum up experience and lessons, will now work a brief summary.To continuously strengthen learning, improve their comprehensive quality. With good comprehensive quality is the precondition of completes the labor of duty and conditions. A year always put learning in the important position, trying to improve their comprehensive quality. Continuous learning professional skills, learn from surrounding colleagues with rich work experience, equip themselves with knowledge, the expanded aspect of knowledge, efforts to improve their comprehensive quality.The second Do best, strictly perform their responsibilities. Set up the company, to maximize the customer to the satisfaction of the company's products, do a good job in technical services and product promotion to the company. And collected on the properties of the products of the company, in order to make improvement in time, make the products better meet the using demand of the scene.Three to learn to be good at communication, coordinating assistance. On‐site technical service personnel should not only have strong professional technology, should also have good communication ability, a lot of a product due to improper operation to appear problem, but often not customers reflect the quality of no, so this time we need to find out the crux, and customer communication, standardized operation, to avoid customer's mistrust of the products and even the damage of the company's image. Some experiences in the past work, mentality is very important in the work, work to have passion, keep the smile of sunshine, can close the distance between people, easy to communicate with the customer. Do better in the daily work to communicate with customers and achieve customer satisfaction, excellent technical service every time, on behalf of the customer on our products much a understanding and trust.Fourth, we need to continue to learn professional knowledge, do practical grasp skilled operation. Over the past year, through continuous learning and fumble, studied the gas generation, collection and methods, gradually familiar with and master the company introduced the working principle, operation method of gas machine. With the help of the department leaders and colleagues, familiar with and master the launch of the division principle, debugging method of the control system, and to wuhan Chen Guchong garbage power plant of gas machine control system transformation, learn to debug, accumulated some experience. All in all, over the past year, did some work, have also made some achievements, but the results can only represent the past, there are some problems to work, can't meet the higher requirements. In the future work, I must develop the oneself advantage, lack of correct, foster strengths and circumvent weaknesses, for greater achievements. Looking forward to XXXX years of work, I'll be more efforts, constant progress in their jobs, make greater achievements. Every year I have progress, the growth of believe will get greater returns, I will my biggest contribution to the development of the company, believe inyourself do better next year!I wish you all work study progress in the year to come.。
---文档均为word文档,下载后可直接编辑使用亦可打印---摘要农村幼儿园教师素质的高低严重影响和制约着农村学前教育的发展,决定着幼儿园教育质量的优劣。
本论文主要以邢台市部分农村幼儿园为例,采用问卷调查法、访谈法、文献研究法等多种调查研究方式,对当前我国农村幼儿教师素质的现状进行了细致分析与研究,结果表明,当前农村幼儿园存在师资力量年轻化,性别比例严重失衡、学历普遍较低,专业知识和专业能力普遍不高、薪资待遇普遍较低,生活条件较差等问题。
这严重阻碍了农村学前教育的发展,因此,要务必提出促进农村幼儿教师成长的相关策略和建议以切实提升农村学前教育的教育水平。
关键词:农村幼儿园教师;教师素质AbstractThe quality of rural kindergarten teachers seriously affects and restricts the development of rural preschool education and determines the quality of kindergarten education. This thesis mainly in xingtai part of rural kindergarten, for example, USES the questionnaire survey method, interview method, many kinds of research approaches such as literature research, the current situation of rural preschool teachers' quality in our country has carried on the detailed analysis and research, analyzes the current rural preschool teachers in problems of quantity, structure, quality first-class, the results show that the current rural preschool teachers education is generally low, professional knowledge and professional ability generally is not high, staff younger, sex ratio imbalance, salary is generally low... This seriously hinders the development of rural preschool education. Therefore, it is necessary to put forward relevant strategies and Suggestions to promote the growth of rural preschool teachers so as to effectively promote the education level of rural preschool education.Keywords: rural kindergarten teachers; the quality of teachers前言随着我国经济的迅速发展,着力构建覆盖城乡、布局合理、公平普惠的学前教育公共服务体系,加强农村幼儿园教师队伍素质的建设,是当今乃至以后幼儿教育发展将一直关注的重点。
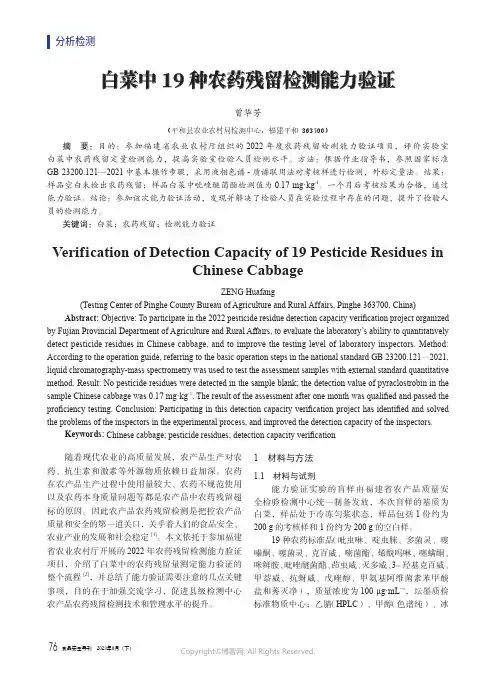
白菜中19种农药残留检测能力验证曾华芳(平和县农业农村局检测中心,福建平和 363700)摘 要:目的:参加福建省农业农村厅组织的2022年度农药残留检测能力验证项目,评价实验室白菜中农药残留定量检测能力,提高实验室检验人员检测水平。
方法:根据作业指导书,参照国家标准GB 23200.121—2021中基本操作步骤,采用液相色谱-质谱联用法对考核样进行检测,外标定量法。
结果:样品空白未检出农药残留;样品白菜中吡唑醚菌酯检测值为0.17 mg·kg-1。
一个月后考核结果为合格,通过能力验证。
结论:参加该次能力验证活动,发现并解决了检验人员在实验过程中存在的问题,提升了检验人员的检测能力。
关键词:白菜;农药残留;检测能力验证Verification of Detection Capacity of 19 Pesticide Residues inChinese CabbageZENG Huafang(Testing Center of Pinghe County Bureau of Agriculture and Rural Affairs, Pinghe 363700, China) Abstract: Objective: To participate in the 2022 pesticide residue detection capacity verification project organized by Fujian Provincial Department of Agriculture and Rural Affairs, to evaluate the laboratory’s ability to quantitatively detect pesticide residues in Chinese cabbage, and to improve the testing level of laboratory inspectors. Method: According to the operation guide, referring to the basic operation steps in the national standard GB 23200.121—2021, liquid chromatography-mass spectrometry was used to test the assessment samples with external standard quantitative method. Result: No pesticide residues were detected in the sample blank; the detection value of pyraclostrobin in the sample Chinese cabbage was 0.17 mg·kg-1. The result of the assessment after one month was qualified and passed the proficiency testing. Conclusion: Participating in this detection capacity verification project has identified and solved the problems of the inspectors in the experimental process, and improved the detection capacity of the inspectors.Keywords: Chinese cabbage; pesticide residues; detection capacity verification随着现代农业的高质量发展,农产品生产对农药、抗生素和激素等外源物质依赖日益加深。
乳腺癌患者疲劳程度测定量表(FACT-F)介绍
乳腺癌是一种常见的恶性肿瘤,患者在治疗过程中经常面临疲劳的问题。
为了衡量乳腺癌患者的疲劳程度,乳腺癌患者疲劳程度测定量表(Functional Assessment of Cancer Therapy - Fatigue,简称FACT-F)被开发出来。
FACT-F 是一种常用的乳腺癌患者疲劳程度测量工具,通过问卷形式收集患者的回答来评估他们的疲劳状况。
该量表由乳腺癌患者生活质量研究小组开发,用于评估乳腺癌患者的疲劳程度和对其生活质量的影响。
量表内容
FACT-F 由四个部分组成:
1. 乳腺癌疲劳测量(乳腺癌相关疲劳的频次和严重程度)
2. 乳腺癌相关的生活质量(乳腺癌对生活质量的影响)
3. 乳腺癌相关症状(与乳腺癌治疗相关的其他症状)
4. 乳腺癌治疗效果(对治疗的满意程度)
每个部分都包含了一系列相关问题,患者需要根据他们的感受回答每个问题。
使用和评估
FACT-F 量表可以通过纸质问卷或在线调查的形式进行填写。
填写过程通常需要患者花费一定的时间来回答所有问题。
根据患者的回答,可以计算出总分和各个分项的得分。
总分越高,表示患者的疲劳程度越低;分项得分越高,表示相关因素对患者的影响越大。
FACT-F 量表是一个广泛应用的工具,可用于研究和临床实践中评估乳腺癌患者的疲劳状况和生活质量。
结论
乳腺癌患者疲劳程度测定量表(FACT-F) 是一种评估乳腺癌患
者疲劳程度和生活质量的常用工具。
通过该量表,医生和研究人员
可以了解患者在治疗过程中的疲劳情况,从而采取相应的干预措施,提高患者的生活质量。
sci 中科院分区表格English answer:Q1: What is the Scimago Journal & Country Rank (SJR)?A1: The Scimago Journal & Country Rank (SJR) is a prestigious ranking system that evaluates the scientific impact of journals and countries. It is developed by the Spanish National Research Council (CSIC).Q2: What are the criteria used to calculate the SJR?A2: The SJR is calculated based on the following criteria:Citation Impact: The average number of citations received by articles published in the journal.Prestige: The prestige of the journal, as determined by the number of citations received by articles publishedin high-impact journals.Collaboration: The level of collaboration among authors who publish in the journal.International Impact: The percentage of citations received from international sources.Q3: How is the SJR presented?A3: The SJR is presented in the form of a table, with journals and countries ranked according to their SJR scores. The table is divided into four quartiles, with Q1 being the highest quartile and Q4 being the lowest quartile.Q4: What is the relationship between the SJR and the Journal Impact Factor (JIF)?A4: The SJR and the JIF are two different metrics usedto evaluate the impact of journals. While the JIF focuseson the number of citations received by articles in ajournal over a two-year period, the SJR takes into accounta wider range of factors, including the prestige of the journal and the international impact of its articles.Q5: What are the advantages of using the SJR?A5: The SJR has several advantages over the JIF, including:It provides a more comprehensive assessment of the impact of journals.It is not as susceptible to manipulation as the JIF.It is more transparent than the JIF.Chinese answer:Q1: 什么是 Scimago 期刊与国家排名 (SJR)?A1: Scimago 期刊与国家排名 (SJR) 是一个著名的排名系统,用于评估期刊和国家的科学影响力。
英语课题第二次问卷调查分析报告范文全文共3篇示例,供读者参考篇1English Class Topic Second Questionnaire Survey Analysis ReportIntroductionIn order to better understand the preferences and needs of students in our English class, a second questionnaire survey was conducted. The survey was aimed at gathering feedback on various aspects of the English class, including teaching methods, materials, and activities. The results of the survey will help us make improvements to the class and provide a better learning experience for the students.MethodologyThe questionnaire was distributed to all students in the English class, and a total of 100 responses were received. The questions covered a range of topics, including the students' preferred learning style, their satisfaction with the current teaching methods, and their suggestions for improvement.Results1. Learning StyleWhen asked about their preferred learning style, the majority of students (60%) indicated that they prefer a combination of visual, auditory, and kinesthetic learning. 20% of students prefer visual learning, 10% prefer auditory learning, and 10% prefer kinesthetic learning.2. Teaching MethodsOverall, students are satisfied with the current teaching methods used in the English class. 80% of students rated the teaching methods as good or excellent, while 20% rated them as fair. However, some students expressed a desire for more interactive and engaging activities in class.3. MaterialsMost students (70%) are satisfied with the materials used in the English class, including textbooks, worksheets, and online resources. However, 30% of students expressed a desire for more diverse and interesting materials to aid their learning.4. ActivitiesThe majority of students (75%) enjoy the activities conducted in the English class, such as group discussions, role plays, and language games. However, 25% of students suggested introducing more real-life scenarios and practical activities to help them apply their English skills in everyday situations.ConclusionOverall, the results of the second questionnaire survey indicate that students are generally satisfied with the current English class but have some suggestions for improvement. Moving forward, we will focus on incorporating more interactive and engaging activities, providing diverse materials, and integrating real-life scenarios into the lessons. By implementing these changes, we aim to enhance the learning experience for the students and help them achieve better results in their English studies. Thank you to all students who participated in the survey and provided valuable feedback.篇2Analysis Report of the Second Questionnaire Survey on English ClassesIntroductionThis report presents the analysis of the second questionnaire survey conducted on English classes in our school. The survey aimed to gather feedback from students on their experiences and opinions regarding the English classes they are currently taking. The survey covered various aspects of the English learning process, including the teaching methods used, the materials used, and the overall satisfaction with the courses.MethodologyThe survey was conducted using an online questionnaire distributed to all students enrolled in English classes in our school. A total of 300 students participated in the survey, which represents a response rate of 85%. The questionnaire consistedof multiple-choice questions, rating scales, and open-ended questions to gather both quantitative and qualitative data.Findings1. Teaching Methods: The survey found that the majority of students (60%) prefer a combination of traditional teaching methods and modern technology in English classes. However, 25% of students expressed a preference for more interactive and experiential learning activities.2. Materials Used: When asked about the materials used in English classes, 45% of students found the textbooks to be helpful, while 35% preferred online resources such as videos, podcasts, and interactive games. Only 20% of students felt that the materials were not engaging or relevant to their learning.3. Class Size: The survey revealed that 70% of students are satisfied with the class size, with most students indicating that smaller classes allow for more individualized attention from teachers. However, 30% of students expressed a desire for larger classes to promote more group discussions and interactions.4. Teacher Effectiveness: Students rated the effectiveness of their English teachers on a scale of 1 to 5, with 1 being the lowest and 5 being the highest. The average rating was 4, indicating that students perceive their teachers as knowledgeable, approachable, and engaging in the classroom.5. Overall Satisfaction: When asked about their overall satisfaction with English classes, 80% of students reported being satisfied or very satisfied with the courses they are currently taking. However, 20% of students expressed concerns about the pace of learning, the assessment methods used, and the lack of opportunities for practice outside of the classroom.RecommendationsBased on the findings of the survey, the following recommendations are proposed to enhance the quality of English classes in our school:1. Incorporate a variety of teaching methods to cater to different learning styles and preferences.2. Utilize a mix of traditional and modern materials to make the learning experience more engaging and relevant.3. Provide opportunities for more interactive and experiential learning activities to enhance student engagement and motivation.4. Consider the preferences of students when assigning class sizes to create a balanced learning environment.5. Encourage teachers to continue their professional development and training to improve their effectiveness in the classroom.6. Address student concerns about the pace of learning, assessment methods, and practice opportunities to ensure a more holistic and comprehensive English learning experience.ConclusionOverall, the findings of the second questionnaire survey provide valuable insights into the strengths and areas for improvement in English classes in our school. By implementing the recommendations outlined in this report, we can enhance the quality of English education and better meet the needs and expectations of our students. Thank you to all the students who participated in the survey and provided valuable feedback for this analysis.篇3Second Questionnaire Survey Analysis Report on English Class TopicIntroductionThe purpose of this report is to present the findings and analysis of the second questionnaire survey conducted on the topic of English class. The survey was carried out to gather insights from students regarding their opinions and feedback on various aspects of the English class, including teaching methods, materials, and overall learning experiences.MethodologyThe second questionnaire survey was administered to a sample of 100 students from different grade levels. The surveyconsisted of multiple-choice questions, rating scales, andopen-ended questions. The data was collected and analyzed using statistical techniques and qualitative analysis.Findings and AnalysisThe findings of the survey revealed several key insights into students' perceptions of the English class. The majority of students reported that they found the English class to be engaging and interesting. They appreciated the use of multimedia resources, such as videos and interactive activities, in the lessons. However, some students also expressed a desire for more opportunities to practice speaking and writing in English.In terms of teaching methods, most students preferred a combination of traditional and modern approaches. They valued the use of textbooks and worksheets for grammar and vocabulary practice, as well as group discussions androle-playing activities for improving communication skills. However, some students felt that there was an over-reliance on the textbook and suggested more creative and interactive teaching methods.When it came to learning materials, students were generally satisfied with the quality of the textbooks and online resources used in the English class. They found the materials to be relevantand helpful in improving their language skills. However, some students also suggested incorporating more authentic andreal-life materials, such as newspapers and articles, to make the learning experience more practical and engaging.Overall, the survey findings indicated that students had a positive outlook on the English class and appreciated the efforts of the teachers to make the lessons engaging and interactive. However, there were also areas for improvement, such as providing more opportunities for speaking and writing practice, using a variety of teaching methods, and incorporating more authentic materials into the curriculum.ConclusionIn conclusion, the second questionnaire survey provided valuable insights into students' perceptions of the English class. The findings highlighted the strengths and weaknesses of the current teaching methods, materials, and overall learning experiences. Based on the feedback received, recommendations can be made to enhance the English class and improve the quality of education provided to students. It is important to continue gathering feedback from students and implementing changes to create a more effective and engaging learning environment in the English class.。
满意度调查报告最新8篇满意度调查报告篇一5月5日从郑州市游客满意度办公室获悉,一季度,中国旅游研究院郑州市游客满意度调查课题组分别对郑州15个县(市)、区和7个重点监测点展开调查,共回收有效问卷2432份,评论2062条。
调查结果显示,一季度,郑州游客满意度指数为71.64,比XX年全年分值略有下降。
其中现场游客调查的满意度为73.12,游客评论的满意度为72.21,网络质监满意度为62.33。
据该课题组负责人中国旅游研究院产业所副研究员何琼峰博士介绍,本季度只有现场调查的满意度远远高于XX年全年,现场调查游客对郑州城市形象的满意度最高,其次是城市公共行业服务的满意度、旅游窗口行业的满意度,而城市建设与管理的满意度最低。
游客对城市公共行业服务满意度比去年有所提高。
该调查报告还显示,一季度,游客对旅游窗口服务的总体满意度高于上年度。
其中,满意度最高的五项是娱乐、购物、景点、总体质量、公共服务;满意度最低的五项是餐饮、旅行社、住宿、交通、导游。
满意度调查报告篇二中国人民银行13日公布的全国城镇储户问卷调查报告称,今年3季度,城镇居民对当前物价的满意程度降低,未来物价走势预期不乐观。
报告认为这与油价房价居高不下有关。
对当前物价满意度降低调查显示,城镇居民对当前物价的满意程度降低,对未来物价走势预期也不乐观。
城镇居民当期物价满意指数为-12.5,较上季降低1.4。
在今年物价涨幅逐渐回落情况下,居民对物价的满意度却逐季走低,居民的感受与实际情况存在较大的差异。
央行分析认为,这主要是因为自年初以来国际市场原油价格飙升,受此影响,国内煤、电、油、运价格不断上涨,商品房价格又居高不下(住房价格不包括在CPI中),居民对物价感到一定的忧虑。
此外,从居民对未来物价的走势看,有36.2%的居民预测物价上升,较上季提高3.7个百分点,6%的居民预测物价下降,较上季降低1.9个百分点,居民对物价的走势不乐观。
储蓄意愿增强而消费下降本季调查显示,在当前物价和利率水平下,认为更多储蓄最合算的居民人数占比为37.9%,较上季提高1.6个百分点,较上年同期提高4.5个百分点。
调查结果英语作文模板Survey Results: An Analysis。
Introduction。
In a recent survey conducted by our research team, we sought to gather insights on the topic of [survey topic]. We surveyed a total of [number of respondents] individuals, representing a diverse demographic profile. The aim of this paper is to present the results of the survey and provide an analysis of the key findings.Research Methodology。
The survey was conducted using an online platform. The survey questionnaire consisted of a mix of open-ended and closed-ended questions designed to elicit responses on various aspects of the research topic. The sample size of [number of respondents] was determined based on statistical considerations and was deemed sufficient to providereliable and generalizable results.Demographic Profile of Respondents。
The respondents were from a range of backgrounds, including:Age: [age range]Gender: [gender distribution]Education: [education levels]Occupation: [occupations represented]Location: [geographic distribution]Survey Results。
英语问卷调查报告范文(经典版)编制人:__________________审核人:__________________审批人:__________________编制单位:__________________编制时间:____年____月____日序言下载提示:该文档是本店铺精心编制而成的,希望大家下载后,能够帮助大家解决实际问题。
文档下载后可定制修改,请根据实际需要进行调整和使用,谢谢!并且,本店铺为大家提供各种类型的经典范文,如公文写作、报告体会、演讲致辞、党团资料、合同协议、条据文书、诗词歌赋、教学资料、作文大全、其他范文等等,想了解不同范文格式和写法,敬请关注!Download tips: This document is carefully compiled by this editor. I hope that after you download it, it can help you solve practical problems. The document can be customized and modified after downloading, please adjust and use it according to actual needs, thank you!In addition, this shop provides you with various types of classic sample essays, such as official document writing, report experience, speeches, party and group materials, contracts and agreements, articles and documents, poems and songs, teaching materials, essay collections, other sample essays, etc. Learn about the different formats and writing styles of sample essays, so stay tuned!英语问卷调查报告范文英语问卷调查报告范文(精选5篇)英语问卷调查报告范文篇1一、调查背景小学阶段开设英语课程的目的是培养学生学习英语的兴趣,形成初步的英语语感,使学生用所学英语进行交际。
英语问卷调查报告范文一、企业家宏观经济热度指数和企业家信心指数企业家宏观经济热度指数为 38.9%,比上季提高 0.2个百分点,比去年同期提高7.6个百分点。
其中,25.0%的企业家认为宏观经济“偏冷”,72.2%认为“正常”,2.8%认为“偏热”。
企业家信心指数为74.3%,比上季提高2.5个百分点,比去年同期提高12.7个百分点。
二、产品销售价格感受指数和原材料购进价格感受指数产品销售价格感受指数为 52.9%,比上季下降3.2个百分点,比去年同期下降 0.7 个百分点。
其中,17.5%的企业家认为本季产品销售价格比上季“上升”,70.9%认为“持平”,11.7% 认为“下降”。
原材料购进价格感受指数为 66.1%,比上季下降2.5个百分点,比去年同期下降 1.9 个百分点。
其中,36.3%的企业家认为本季原材料购进价格比上季“上升”,59.6%认为“持平”,4.1%认为“下降”。
三、出口订单指数和国内订单指数出口订单指数为 45.0%,比上季下降 3.5个百分点,比去年同期提高 3.4 个百分点。
其中,15.6%的企业家认为出口订单比上季“增加”,58.8%认为“持平”,25.6%认为“减少”。
国内订单指数为 47.6%,比上季下降 5.3个百分点,比去年同期提高 3.7个百分点。
其中,17.2%的企业家认为本季国内订单比上季“增加”,60.8%认为“持平”,22.0%认为“减少”。
四、资金周转指数和销货款回笼指数资金周转指数为 58.7%,比上季下降 0.1 个百分点,比去年同期提高 2.4 个百分点。
其中,34.1%的企业家认为本季资金周转状况“良好”,49.2%认为“一般”,16.7% 认为“困难”。
销货款回笼指数为 63.8%,比上季提高 0.1 个百分点,比去年同期提高 3.8 个百分点。
其中,38.2%的企业家认为本季销货款回笼状况“良好”,51.2%认为“一般”,10.6% 认为“困难”。
1 0908010101 范雨菲1.某饮料生产企业研制出一种新型饮料。
饮料的颜色共有四种,分别为桔黄色,粉色,绿色和无色透明。
随机从五家超级市场收集了前一期该种饮料的销售量,如下表所示,试问饮料的颜色是否对销售量产生影响。
用Excel中的方差分析工具进行方差分析。
(α=0.05)超市桔黄色粉色绿色无色1 26.5 31.2 27.9 30.82 28.7 28.3 25.1 29.63 25.1 30.8 28.5 32.44 29.1 27.9 24.2 31.75 27.2 29.6 26.5 32.82.对平炉炼钢实验进行工艺改革,先用原方法炼一炉,然后用改革工艺后的方法炼一炉,以后这样交替进行,各炼10炉,考察指标如下表。
原方法78.1 72.4 76.2 74.3 77.4 78.4 76.0 75.5 76.7 77.32 0908010102 林琳1. .某饮料生产企业研制出一种新型饮料。
饮料的颜色共有四种,分别为桔黄色,粉色,绿色和无色透明。
随机从五家超级市场收集了前一期该种饮料的销售量,如下表所示,试问饮料的颜色是否对销售量产生影响。
用Excel中的方差分析工具进行方差分析。
(α=0.1)超市桔黄色粉色绿色无色1 25.5 30.8 28.5 31.22 28.8 29.6 27.0 28.33 26.0 32.4 28.4 30.54 29.0 31.7 25.2 27.05 27.0 32.8 26.5 27.62. 对某国产汽车和某进口汽车进行抽样,并测定启动速度,结果如下表,在显著性水平α=0.05下,检验该国产汽车的启动速度是否已达到了进口汽车的水平。
国产车(s)8.19.18.99.49.67.28.99.28.899.49.5进口车(s)9.57.698.97.89.289.49.17.48.37.13 0908010103 李婷婷1.某饮料生产企业研制出一种新型饮料。
---Executive SummaryThe purpose of this survey was to [state the purpose of the survey, e.g., gather feedback on customer satisfaction, assess employee engagement, or understand consumer preferences]. The survey was distributed to [number] participants, with a majority being [age range, gender, occupation, etc.]. The report provides an overview of the key findings, insights,and recommendations based on the responses received.---IntroductionThe [Survey Name] was conducted from [start date] to [end date] to [briefly describe the purpose of the survey]. The survey was designed to [mention specific objectives, e.g., identify areas of improvement, measure satisfaction levels, or explore consumer behavior]. The questionnaire consisted of [number] questions, which were divided into [number] sections: [list the sections, e.g., demographics, product preferences, service quality, etc.].---MethodologySample Population:The survey was targeted at [describe the target population, e.g., adult consumers, employees of a particular company, students, etc.]. Participants were recruited through [methods of recruitment, e.g., email invitations, social media, online forums, etc.].Data Collection:The survey was conducted online using [mention the platform used, e.g., SurveyMonkey, Google Forms, etc.]. Participants were asked to complete the questionnaire within [time frame, e.g., 10 minutes].Data Analysis:The responses were analyzed using [mention the software or method used, e.g., SPSS, Excel, statistical analysis, etc.]. Descriptive statistics, such as mean, median, mode, and standard deviation, were used to summarize the data. In addition, inferential statistics were employed to determine if there were significant differences between groups.---Key FindingsSection 1: Demographics- [Findings related to demographics, e.g., age distribution, gender, income level, etc.]Section 2: Product/Service Experience- [Findings related to product or service experience, e.g., satisfaction with the product, ease of use, quality, etc.]Section 3: Service Quality- [Findings related to service quality, e.g., customer service satisfaction, responsiveness, problem resolution, etc.]Section 4: Overall Satisfaction- [Findings related to overall satisfaction, e.g., overall rating of the product/service, likelihood to recommend, etc.]Section 5: Open-Ended Questions- [Summary of insights gained from open-ended questions, e.g., suggestions for improvement, feedback on specific features, etc.]---Insights and RecommendationsBased on the survey findings, the following insights and recommendations are provided:1. Insight: [Insight gained from the survey, e.g., there is asignificant gap in customer satisfaction with the product's durability.]Recommendation: [Recommendation based on the insight, e.g., invest in improving the durability of the product and communicate this enhancement to customers.]2. Insight: [Another insight, e.g., a majority of participants expresseda desire for more personalized services.]Recommendation: [Recommendation, e.g., develop a personalized service plan and train staff to deliver a more tailored experience.]3. Insight: [Additional insights, e.g., there is a lack of awareness about certain features of the product.]Recommendation: [Recommendation, e.g., create educational content to inform customers about the full range of product features.]---ConclusionThe [Survey Name] has provided valuable insights into [briefly summarize the main findings]. The data collected will inform future decision-making and strategic planning for [company/organization name]. The recommendations outlined in this report are intended to address the areas identified for improvement and enhance the overall experience for [customers/employees,。
在英语作文里面运用关于调查结果公关Using Survey Results for Public RelationsEffective public relations (PR) campaigns often rely on data-driven insights to craft compelling narratives and engage target audiences. One invaluable source of such insights is survey research, which can provide a wealth of information about consumer attitudes, behaviors, and perceptions. By incorporating survey results into their PR strategies, organizations can develop more informed and impactful communications that resonate with their stakeholders.The power of survey data in public relations lies in its ability to uncover nuanced understandings of the target audience. Through well-designed surveys, organizations can gain a deeper understanding of their customers' pain points, preferences, and decision-making processes. This information can then be leveraged to craft messaging that directly addresses the needs and concerns of the audience, making the communications more relevant and persuasive.For example, a company launching a new product might conduct a survey to gauge consumer interest and identify the key features that are most important to potential buyers. The survey results could reveal that customers are particularly interested in the product's environmental sustainability and ease of use. Armed with this knowledge, the company's PR team can develop a campaign that highlights these attributes, positioning the product as a socially responsible and user-friendly solution to the target market's needs.Beyond informing messaging, survey data can also play a crucial role in shaping the overall PR strategy. By understanding the target audience's media consumption habits, communication preferences, and level of engagement with the organization, PR professionals can tailor their outreach efforts to maximize impact. For instance, if a survey indicates that the target audience is highly active on social media, the PR team may choose to focus more on developing a robust social media presence and leveraging influencer partnerships to reach their audience effectively.Moreover, survey results can be instrumental in measuring the success of a PR campaign and guiding future strategies. By conducting pre- and post-campaign surveys, organizations can assess the impact of their communications on key metrics such as brand awareness, sentiment, and purchase intent. This data can then be used to refine the PR approach, identify areas for improvement,and demonstrate the tangible value of the PR efforts to organizational stakeholders.One notable example of the strategic use of survey data in public relations is the case of the American Red Cross. In the aftermath of Hurricane Katrina, the organization faced significant public criticism for its perceived mishandling of disaster relief efforts. To address this crisis, the Red Cross commissioned a comprehensive survey to understand the public's perceptions of the organization and identify areas for improvement.The survey findings revealed that the public's primary concerns centered around transparency, accountability, and the Red Cross's ability to effectively respond to disasters. Armed with these insights, the organization's PR team developed a multi-faceted campaign that focused on improving communication, strengthening partnerships with local communities, and demonstrating the organization's commitment to responsible stewardship of donor funds.The campaign's success was evident in the subsequent survey results, which showed a significant improvement in the public's trust and confidence in the American Red Cross. By using survey data to guide their PR strategy, the organization was able to effectively address the crisis and rebuild its reputation as a reliable and trustworthy humanitarian aid organization.The integration of survey research into public relations is not limited to crisis management; it can also be applied to proactive brand-building and reputation enhancement efforts. For instance, a company seeking to position itself as an industry leader might conduct a survey to understand the key factors that influence customer perceptions of industry leaders. The survey results could then inform the development of a PR campaign that highlights the company's strengths in those areas, reinforcing its position as a trusted and respected player in the market.Similarly, non-profit organizations can leverage survey data to better understand the motivations and concerns of potential donors, allowing them to craft more compelling fundraising campaigns and build stronger relationships with their supporter base. By aligning their PR strategies with the insights gleaned from survey research, these organizations can more effectively communicate their mission, impact, and value proposition to their target audiences.In conclusion, the strategic integration of survey results into public relations strategies can be a powerful tool for organizations seeking to enhance their brand reputation, engage their stakeholders, and achieve their communication objectives. By leveraging the insights gained from well-designed surveys, PR professionals can develop more informed, targeted, and impactful communications thatresonate with their target audiences and drive meaningful outcomes. As the business landscape continues to evolve, the ability to effectively harness the power of data-driven insights will become increasingly crucial for organizations looking to stay ahead in the competitive world of public relations.。
- 46 -①枣庄市精神卫生中心(枣庄市立第二医院)老年病一科 山东 枣庄 277400通信作者:贾曦瑞舒伐他汀联合多奈哌齐对血管性痴呆患者认知功能及日常生活活动能力的影响贾曦①【摘要】 目的:探讨瑞舒伐他汀联合多奈哌齐对血管性痴呆患者认知功能及日常生活活动能力的影响。
方法:选择枣庄市精神卫生中心2020年5月—2022年11月收治的98例血管性痴呆患者为研究对象,以随机数字表法分为两组。
对照组(49例)服用多奈哌齐,观察组(49例)服用瑞舒伐他汀和多奈哌齐,两组均用药3个月。
比较两组临床疗效、认知功能[简易智力状态检查量表(MMSE)]、炎症因子[C 反应蛋白(CRP)]、日常生活活动能力[日常生活能力量表(ADL)]、不良反应。
结果:观察组总有效率为89.80%,高于对照组的73.47%,治疗后观察组MMSE、ADL 分值均高于对照组,CRP 低于对照组,差异均有统计学意义(P <0.05);两组不良反应发生率比较,差异无统计学意义(P >0.05)。
结论:针对血管性痴呆患者采取瑞舒伐他汀联合多奈哌齐治疗,可改善患者认知功能与日常生活能力,并有效调控炎症因子水平,安全性良好。
【关键词】 血管性痴呆 瑞舒伐他汀 多奈哌齐 认知功能 日常生活活动能力 Effects of Rosuvastatin Combined with Donepezil on Cognitive Function and Activities of Daily Living in Patients with Vascular Dementia/JIA Xi. //Medical Innovation of China, 2024, 21(06): 046-049 [Abstract] Objective: To investigate the effect of Rosuvastatin combined with Donepezil on cognitive function and activities of daily living in patients with vascular dementia. Method: A total of 98 patients with vascular dementia admitted to Zaozhuang Mental Health Center from May 2020 to November 2022 were selected as the study subjects, and they were divided into two groups by random number table method. The control group (49 cases) received Donepezil, and the observation group (49 cases) received Rosuvastatin and Donepezil. Both groups received the drug for 3 months. The clinical efficacy, cognitive function [mini-mental state examination (MMSE)], inflammatory factors [C reactive protein (CRP)], activities of daily living [activities of daily living scale (ADL)], and adverse reactions were compared between the two groups. Result: The total effective rate of the observation group was 89.80%, which was higher than 73.47% of the control group, after treatment, the MMSE and ADL scores of the observation group were higher than those of the control group, while the CRP was lower than that of the control group, with statistically significant differences (P <0.05). There was no statistically significant difference in the incidence of adverse reactions between the two groups (P >0.05). Conclusion: Rosuvastatin combined with Donepezil can improve the cognitive function and the activities of daily living of patients with vascular dementia, regulate the levels of inflammatory factors, has good safety. [Key words] Vascular dementia Rosuvastatin Donepezil Cognitive function Activities of daily living First-author's address: Department of Geriatrics Ⅰ, Zaozhuang Mental Health Center, Zaozhuang 277400, China doi:10.3969/j.issn.1674-4985.2024.06.011 血管性痴呆通常是由于各种脑血管病变导致脑组织损伤,并诱发大脑功能减退的综合征[1]。
Conners父母症状问卷的中国城市常模*苏林雁,李雪荣,黄春香,罗学荣,张纪水(中南大学湘雅二医院精神卫生研究所,湖南长沙,410011)儿童行为评定量表全国协作组*【摘要】 目的:建立Conners父母症状问卷(PSQ)的中国城市常模并检验其信度和效度。
方法:在全国20个城市采样1759例(男890,女869),平均11.39±2.57岁;由父母填写PSQ。
结果:量表的重测信度0.15~0.63、分半信度0.88、Crobachα系数0.92、项目与总分的一致性0.49~0.85。
量表的效度较好,与Achenbach CBCL、Conners教师评定量表的各分量表呈对应性相关,多动症儿童得分高于常模,多动指数对多动症诊断的灵敏度为84%。
结论:Conners 父母症状问卷适用于我国儿童多动症的评估。
【关键词】 儿童;行为;常模;信度;效度中图分类号:G449.1 文献标识码:A 文章编号:1005-3611(2001)04-0241-03 Norms of The Conners Parent Symptom Questionnaire in Chinese Urban ChildrenSU Lin-y an,LI Xue-rong,HUANG Chun-xiang,LUO Xue-rong,ZhANG Ji-shuiMental Health Institute,Central South University,Changsha410011,China【Abstract】 Objective:To develop the norm of Parent Symptom Questionnaire(PSQ)in Chinese urban children and to test the re-liability and validit y of this scale.Methods:Parents of a total of1759subjects(890males and869females)from20cities of Chi-na with the mean age11.39±2.57completed the scale.Results:The reliability was good.Significant correlations were found be-tween the total scores,Hyperactivity index of PSQ and CBCL,and the Conners TRS.The scores of children with hyper-kinetic s yndrome and emotional disorders were higher than that of norm subjects.Co nclusion:PSQ was found to have good ps y chometrics properties,with adequate reliability and validity.In particular,the PSQ is applicable to assess hyper-kinetic syndrome of Chi-nese children.【Key Words】 Children;Behavior rating scale;Norm;Reliability;Validity Conners父母症状问卷(Parent Symptom Question-naire,PSQ)是Conners编制的父母用儿童行为评定量表,主要评估儿童多动症,可用于临床辅助诊断及科研,也可作为筛查工具用于流行学调查。
rankings basedon survey resultsRankings based on survey results are a common way to evaluate and compare different products, services, or companies. Surveys are typically designed to collect feedback from a large group of people, and the results are then used to create rankings that reflect the opinions of the respondents.To create a ranking based on survey results, you typically need to follow several steps:1. Design the survey: The survey should be designed to collect feedback on the specific products, services, or companies you want to evaluate. The survey should include questions that seek opinions, preferences, and satisfaction levels.2. Conduct the survey: The survey is then distributed to a large group of people, typically through an online platform or through direct mail. It's important to have a diverse group of respondents to ensure that the results are representative of different perspectives and opinions.3. Analyze the data: After the survey is complete, the data is analyzed to determine the responses to each question. The data can be analyzed quantitatively or qualitatively, depending on the type of information collected.4. Create the rankings: Once the data is analyzed, it can be used to create rankings by comparing the responses across different products,services, or companies. The rankings can be based on different factors such as overall satisfaction, quality, value, or any other relevant metric determined by the survey questions.5. Publish the rankings: The rankings are then published in a report, online, or through other channels to inform consumers and businesses about the products, services, or companies that performed well in the survey.It's important to note that rankings based on survey results should be interpreted with caution. While they provide valuable insights into consumer preferences and satisfaction levels, it's important to consider the limitations of surveys, such as potential biases or limited sample sizes.。
Agenda Item IV Private Company Financial Reporting CommitteeFIN 48 Survey ResultsFinancial Statement UsersApril, 2008SummaryThe data indicates that the users who responded to the survey tend to find information about uncertain tax positions as largely irrelevant to their purposes when using financial statements. The usefulness of the FIN 48 disclosure requirements did not rate high, nor did the usefulness of the alternative narrative disclosures.Respondent Demographics∙80 responseso39% - Lenders/creditorso18% - Surety/bonding firmso16% - Investors/venture capitalistso27% - Other (mostly people who identified themselves as CPAs; and thena mix of individual investors, CFOs, investment banker, vendor, creditunion, student, company owner, etc.)∙Respondents utilized the financial statements of all sizes of private companies and pass-through entities.A) Relevance/Usefulness of FIN 48 Reconciliation Components1) The gross amounts of increases and decreases in unrecognized tax benefits as aresult of tax positions taken during the current periodo46% - Lowo26% - Mediumo21% - Higho6% - Don’t knowo1% - N/A2) The gross amounts of the increases and decreases in unrecognized tax benefits asa result of tax positions taken during a prior periodo51% - Lowo26% - Mediumo14% - Higho8% - Don’t knowo1% - N/A3) Reductions to unrecognized tax benefits as a result of a lapse of the applicablestatute of limitationso57% - Lowo18% - Mediumo15% - Higho9% - Don’t knowo1% - N/A4) The amounts of decreases in the unrecognized tax benefits relating to settlementswith taxing authoritieso52% - Lowo21% - Mediumo18% - Higho8% - Don’t knowo1% - N/AB) If you rated the reconciliation components Hi or Med, how would you usethem?o Respondents indicated cash flow analysis and some other form of analytics.C) If the costs of providing the information in the tabular reconciliation weresignificant to the company that prepares the financial statements you use or evaluate, would the benefits of such a tabular reconciliation be worth the significant preparation costs?o Definitely No – 27%o Probably No – 44%o Definitely Yes – 4%o Probably Yes – 14%o Don’t Know– 11%D) If the costs to you to learn about and understand the information in thetabular reconciliation are significant, would the benefits of such a tabular reconciliation be worth the significant costs?o Definitely No – 25%o Probably No – 50%o Definitely Yes – 1%o Probably Yes – 21%o Don’t Know– 3%E) Rating the Relevance/Usefulness of Additional Disclosure Componentso The total amount of unrecognized tax benefits that, if recognized, would affect the effective tax rate.▪Low – 48%▪Medium – 28%▪High – 18%▪Don’t Know – 5%▪N/A – 1%o The total amounts of interest and penalties recognized in the statement of operations and the total amounts of interest and penalties recognized in thestatement of financial position.▪Low – 46%▪Medium – 32%▪High – 18%▪Don’t Know – 3%▪N/A – 1%o For tax positions for which it is reasonably possible that the total amounts of unrecognized tax benefits will significantly increase or decrease within12 months of the reporting date ─ The nature of the uncertainty▪Low – 30%▪Medium – 40%▪High – 20%▪Don’t Know – 9%▪N/A – 1%o The nature of the event that could occur in the next 12 months that would cause the change.▪Low – 33%▪Medium – 34%▪High – 27%▪Don’t Know – 5%▪N/A – 1%o An estimate of the range of the reasonably possible change or a statement that an estimate of the range cannot be made.▪Low – 44%▪Medium – 31%▪High – 16%▪Don’t Know – 8%▪N/A – 1%F) If you rated the additional disclosure components Hi or Med, how would youuse them?o Respondents indicated cash flow analysis and some other form of analytics.G) Rating the relevance/usefulness of the PCFRC’s alternative narrativedisclosure:o Low – 56%o Medium – 32%o High – 9%o Don’t Kn ow – 3%H) Does the qualitative information in the PCFRC alternative disclosure meetyour needs?o Definitely No – 12%o Probably No – 20%o Definitely Yes – 8%o Probably Yes – 48%o Don’t Know– 12%I) If you rated the information provided in the PCFRC alternative disclosureHi or Med, indicate below how you would use that information in evaluating your decision to extend credit or invest money.o Respondents indicated cash flow analysis and some other form of analytics.J) Rating the relevance/usefulness of presenting in the balance sheet a liability for unrecognized tax benefits.o Low – 50%o Medium – 27%o High – 19%o Don’t Know – 4%K) If you rated the presentation of a liability for the aggregate unrecognized tax benefits in the balance sheet “Hi” or “Med”, indic ate below how you would use the presentation of that liability in evaluating your decision to extend credit or invest money.o Respondents indicated cash flow analysis and some other form of analytics.L) Rating the importance of your client’s tax positions taken in a tax return in evaluating your decision to extend credit or invest money.o Low – 47%o Medium – 28%o High – 21%o Don’t Know – 4%M) Would you grant your client a GAAP exception related to FIN 48?o Definitely No – 1%o Probably No – 16%o Definitely Yes – 17%o Probably Yes – 49%o Not Sure – 175。