CarSim初步教程
- 格式:ppt
- 大小:6.18 MB
- 文档页数:18
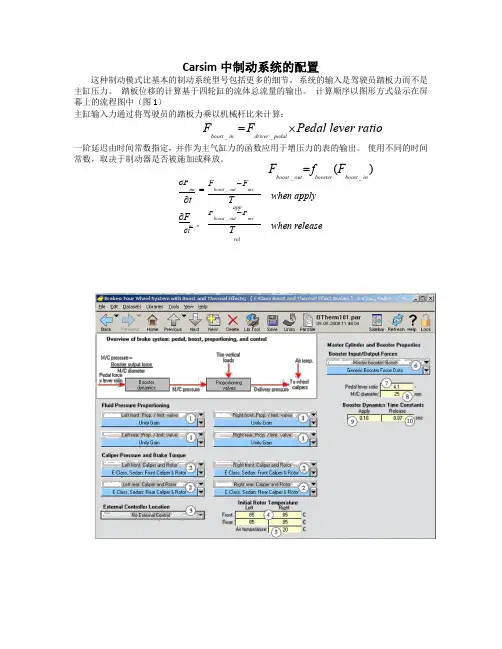
Carsim 中制动系统的配置这种制动模式比基本的制动系统型号包括更多的细节。
系统的输入是驾驶员踏板力而不是主缸压力。
踏板位移的计算基于四轮缸的流体总流量的输出。
计算顺序以图形方式显示在屏幕上的流程图中(图1)主缸输入力通过将驾驶员的踏板力乘以机械杆比来计算:Fboost _ in=Fdriver _ pedal⨯Pedal lever ratio一阶延迟由时间常数指定,并作为主气缸力的函数应用于增压力的表的输出。
使用不同的时间常数,取决于制动器是否被施加或释放。
Fboost _ out =f booster (F boost _ in)when applywhen release∂Fmc=Fboost _ out-Fmc∂tapp∂FFboost _ out-Fmcmc =T∂trel主缸(M / C )压力由M / C 输出力除以M / C 面积给出:P mc = Fmc(M / C diameter )2⨯ π / 4然后M / C 压力通过比例阀,作为输送压力到达轮胎卡钳:P del=fprop(P mc,Fz _ whl)主缸位移由所有车轮除以M / C 面积的轮缸体积的总和给出:X mc =V lf+V rf+V lr+Vrr(M / C diameter )2⨯ π / 4Xpedal= X mc ⨯ Pedal lever ratio其中Xmc 和Xpedal 分别是主缸位移和踏板位移。
每个车轮的轮缸体积(V )在另一个屏幕中指定,制动器:卡尺和转子属性,从表示每个车轮的该屏幕链接,指定系统从输送压力到制动转矩的行为。
轮缸体积(V )为:R P P c del/)(Q -=;⎰=Qdt V式中P del 为传递的压力,Pc 为当前轮缸的压力,R 为effective resistance 。
carsim建模仿真手册一、引言Carsim(Car Simulation)是一个用于汽车动力学仿真的软件。
它提供了一个精确且强大的模型,可用于模拟汽车的动态行为。
本文档旨在提供使用Carsim进行建模仿真的基本指南。
二、Carsim介绍Carsim是由意大利的Simulink和MathWorks公司共同开发的。
它基于Simulink平台,允许用户使用图形界面进行建模和仿真。
Carsim提供了丰富的车辆模型库,包括车辆动力学、轮胎模型、驾驶员模型等,使得用户能够快速构建复杂的车辆系统模型。
三、建模步骤1.建立车辆模型:首先,需要在Carsim中定义车辆的几何形状、质量和惯性等参数。
这些参数对于车辆的动力学行为至关重要。
2.添加轮胎模型:轮胎是车辆与地面接触的关键部分,其行为对车辆的操控性和稳定性有重要影响。
Carsim提供了多种轮胎模型,用户可以根据需要选择和调整。
3.定义驾驶员模型:驾驶员模型用于模拟驾驶员的驾驶行为,如加速、制动和转向等。
Carsim提供了多种驾驶员模型,用户可以根据实际需求进行选择和调整。
4.连接模型:将上述各个部分连接起来,形成一个完整的车辆系统模型。
连接时需确保所有输入和输出信号的一致性。
四、仿真与结果分析1.运行仿真:设置仿真参数,如仿真时间、步长等,然后开始仿真。
2.查看仿真结果:仿真结束后,可以查看各种输出数据,如速度、加速度、横摆角速度等。
这些数据可以用于评估车辆的性能和操控性。
3.结果分析:根据仿真结果,可以对车辆的设计进行优化。
例如,调整轮胎参数或驾驶员模型参数,以改善车辆的操控性或燃油经济性。
五、结论Carsim为汽车动力学建模仿真提供了一个强大的工具。
通过遵循上述步骤,用户可以快速构建复杂的车辆系统模型,并进行仿真和分析。
这对于车辆设计、开发和测试具有重要意义。
汽车动力学模型基础方程在汽车工程中,动力学模型是一个重要的概念,它描述了汽车在运动过程中的力学特性和行为。
其中,汽车动力学模型的基础方程起着至关重要的作用,它们是描述汽车动力学特性的数学表达式,是汽车工程中的核心理论基础。
一、运动方程汽车在运动中受到多种力的作用,这些力包括牵引力、阻力、重力等。
通过牛顿第二定律,可以得到描述汽车运动的基本方程:F = ma其中,F是受到的合外力,m是汽车的质量,a是汽车的加速度。
根据牵引力、阻力和重力的关系,可以得到更加细致的运动方程:F_traction - F_drag - F_roll - F_grade = ma其中,F_traction是牵引力,F_drag是阻力,F_roll是滚动阻力,F_grade是上坡或下坡时产生的力。
这些力可以通过具体的公式计算得到,从而得到汽车的加速度。
二、转向方程在汽车运动中,转向是一个重要的问题。
汽车的转向能力与转向系的设计和轮胎的特性有关。
描述汽车转向行为的基础方程可以通过转向角速度、侧向力和横摆刚度等参数建立,具体方程如下:Mz = Iz * ωz + Fy * a其中,Mz是横摆力矩,Iz是车辆绕垂直轴的惯性矩,ωz是车辆的横摆角速度,Fy是轮胎的侧向力,a是车辆的横向加速度。
这个方程描述了汽车在转向过程中受到的各种力的平衡关系。
三、刹车方程刹车是汽车行驶中不可或缺的部分,汽车刹车性能与刹车系统、轮胎和路面特性等有关。
汽车刹车性能的基础方程可以描述如下:Fbrake = μ * Fz其中,Fbrake是刹车力,μ是刹车系数,Fz是轮胎受力。
刹车系数与刹车系统和轮胎的摩擦特性有关,它是刹车性能的一个重要参数。
总结通过以上的分析可以看出,汽车动力学模型的基础方程是汽车工程中的核心内容,它涉及到多个力学和运动学的概念,并且需要深入的数学和物理知识。
汽车动力学模型的基础方程不仅对汽车设计和优化具有重要意义,对于理解汽车行驶过程中的各种力学特性也有着重要意义。
CarSim仿真快速⼊门(⼀)未经作者授权,禁⽌任何形式的转载!⼀. 介绍1. 1 CarSim软件包含三个主要的部分:VehicleSim (VS): VS Solvers使⽤详细的物理模型来模拟⾼速公路车辆及其控制器的动态⾏为,对驾驶员的控制、3D地⾯⼏何形状及空⽓动⼒学做出相应的相应。
VS Visualizer使⽤虚拟摄像机和绘图显⽰模拟结果。
CarSim图形⽤户界⾯(GUI)可以访问车辆,道路,测试条件以及⽀持视频动画和绘图的信息的数据库。
1.2 将会学到什么?车辆动⼒学的⾼精度的仿真模拟需要⼤量数据。
CarSim包括⼀个包含许多⽰例车辆和测试流程的数据库。
如果⽤户还不熟悉CarSim,特别是⼀开始对GUI和数据库不熟悉。
本⽂旨在介绍GUI和数据库的主要元素,以便⽤户熟悉CarSim的组织加⼯和基本⼯具。
期望利⽤⼏个⼩时来完成所有步骤。
本⽂旨在介绍使⽤CarSim的使⽤经验。
因此,将向⽤户展⽰如何创建新数据库,以及如何在不与现有数据集冲突的情况下创建新数据集。
在本教程中,不必掌握CarSim中的所有选项和功能,CarSim包含软件中包含的⼤量⽂档,本⽂在以后的章节中会对这些⽂档进⾏讲解。
⼆. 查看仿真结果如何在CarSim中查看仿真结果,我们将从查看现有⽰例开始。
稍后,将运⾏⼀个新的仿真。
在准备过程中,将⾸先创建⼀个新数据库,以便在学习本教程时使⽤。
这样避免了对其他已安装⽰例进⾏意外修改的可能性。
2.1 启动CarSim并创建⼀个新数据库通过使⽤“开始”菜单或双击桌⾯上的CarSim图标来启动CarSim(具体取决于您的Windows 版本)。
CarSim启动时,它会弹出⼀个对话框来选择数据库(图1)。
在正常操作中,将选择⼀个数据库(例如①)并继续②。
但是,对于本⽂,我们将创建⼀个包含单个车辆和测试条件的新数据库。
图 1. 从CarSim安装中打开数据库.点击按钮 Create a new database from a Consolidated Parsfile③。


Vehicle ScreensOverview of Vehicle Screens (1)The Vehicle Assembly Screen (2)The Vehicle Trailer Screens (5)The Vehicle: Loaded Condition Screen (6)Sprung Mass Parameter Definitions (8)Suspension Kinematics, Zero Jounce, and Wheel Center Heights (8)Coordinate System (9)Aerodynamics (9)Frame Twist (9)The Vehicle: Sprung Mass screen (11)The Vehicle: Sprung Mass (from Whole Vehicle) Screen (14)The Vehicle: Trailer Sprung Mass Screen (17)Overview of Vehicle ScreensWhen specifying a vehicle from the Run Control screen, you typically link to a dataset from one of two vehicle screens:1.Vehicle: Assembly — assemble the vehicle from datasets that define the major systemsand components. The vehicle as defined by this screen is considered to be in the design load condition (sometimes called curb condition).2.Vehicle: Loaded Condition — combine a motor vehicle (from the Vehicle: Assemblylibrary) with additional masses, virtual sensors and trailers. Changes in loading conditions or sensor locations can be made by changing a few links, without making any changes in the basic vehicle description.The two main vehicles screens make use of these supporting screens for trailers and sprung mass properties that are also described in this document.3.Trailers — use two screens similar to the Vehicle: Assembly screen to assemble trailerswith one and two axles.4.Vehicle: Sprung Mass — set size and weight information about the sprung mass of themain vehicle.5.Vehicle: Sprung Mass (from Whole Vehicle) — an alternative screen to set size andweight information using measurement made from the whole vehicle.6.Vehicle: Trailer Sprung Mass — set size and weight information about the sprung massof a trailer.The Vehicle Assembly ScreenFigure 1 shows the Vehicle: Assembly screen on which the components and systems of a car or other four-wheeled motor vehicle are assembled.123456 789108111213148111213141414 Figure 1: Vehicle: Assemblyscreen.Link to a Vehicle: Sprung Mass or Vehicle: Sprung Mass (from Whole Vehicle) datasetthat defines the properties of the sprung mass.Link to an Aerodynamics: Main Screendataset.Link to an animator dataset. This is usually a dataset from the library Animator: Vehicles and Sensor Targets, but can be any dataset that defines the shape of the sprung mass for thewhen the link is made.Drop-down list for specifying the type of powertrain. The option chosen determines the kind of control that appears directly underneath.1. If the powertrain is Speed control (min. powertrain), two data fields are shown (Figure2).Figure 2. Data field with simple speed control and no powertrain details.The first is the ratio of drive torque (from the speed controller) that goes to the rear wheels (keyword = R_REAR_DRIVE_SC). Use 0 for simple front-wheel drive, 1 for simple rear-wheel drive, and 0.5 for simple four-wheel drive.The second data field is the power limit used by the speed controller (keyword = PMAX_SC). The speed controller uses proportional-integral control to try to match a target speed. The power being transferred to the wheels is monitored and not allowed to exceed this limit.2. If the powertrain is Front-wheel drive, a link is shown to a Powertrain: Front-WheelDrive dataset.3. If the powertrain is Rear-wheel drive, a link is shown to a Powertrain: Rear-WheelDrive dataset.4. If the powertrain is 4-wheel drive, a link is shown to a Powertrain: 4-Wheel Drivedataset.5Link to a Brakes: Four-Wheel System dataset.6Link to a Steering System dataset.7Miscellaneous field. This is a location for specifying parameters for extensions to the model or information for the animator.8Miscellaneous links. These have no predefined purpose, but can be linked to datasets that specify parameters for extensions to the model or information for the animator. The data from the link in the left column applies to the sprung mass or whole vehicle. Data from the other two links apply to the front or rear suspension, as indicated by their locations on the screen.93x1 image scale checkbox. If the image of the vehicle looks distorted, try checking or unchecking this box to improve the appearance.Note When working with datasets from older versions of the software (before 2009), images associated with datasets might have been included that arescaled for a 3x1 aspect ratio (the image is three times wider than it ishigh). Images that are created automatically from within the VS browserhave a 2x1 aspect ratio.10Image of vehicle. When you change the link to the animator dataset 3, the associate image from that dataset is shown here. You can also specify an alternate image by clicking on the image to display a drop-down list of options. See the VS Browser Reference Manual for details about these options.11Drop-down list for selecting a type of suspension data. There are four choices for the front suspension, and five for the rear (shown below).The first two specify an independent suspension described either with a single screen (simple) or a set of two screens (full nonlinear). If the Independent (simple) choice is selected, then the link underneath is used to connect Suspension: Independent System13Independent (fully nonlinear) Suspension: Independent System Kinematics and the link for Suspension: Independent Compliance, Springs, and Dampers13is available. The next two choices are two options nonlinear). A twist beam suspension can be specified for the rear.1211simplified overall suspension dataset.1311 list is set for a simplified suspension screen, then this link is hidden.14Links to Tire datasets for the four tires.The Vehicle Trailer ScreensThere are two screens, Vehicle: Trailer with 1 Axle screen and Vehicle: Trailer with 2 Axles screen, to assemble the major systems and components of a one-axle and two-axle trailer, respectively. The trailers as defined by those screens are considered to be in the unladen condition (often called curb condition). Additional masses and inertias can be added or subtracted on the Vehicle: Loaded Condition screen using payloads.Figure 3 shows the Vehicle: Trailer with 2 Axle screen. The Vehicle: Trailer with 1 Axle screen is very similar to the other, except that the properties for the second axle and tandem suspension parameters do not exist.1234578910811121314141112131414151617 Figure 3: Vehicle: Trailer with 2 Axles screen.The settings for the two trailer screens are nearly identical to those of the Vehicle: Assembly screen described in the previous section. The main differences are:1. There are only two options for suspension types, so a checkbox is usedtrailerscreens rather than the drop-down list used for the Vehicle: Assembly2.Vehicle: Assembly screen has powertrain data; the trailer screens have hitch data3. The Vehicle: Trailer with 2 Axles screen has some parameters for a tandem suspension. The user controls that are specific to the trailer screens are described below; for all others, please see the descriptions in the previous section.Link to a Vehicle: Trailer Sprung Mass dataset.Link to a Hitch dataset. This defines stiffness properties and moment preloads of the hitch.Link to a brake system dataset appropriate for the number of wheels on the trailer (Brakes: Two-Wheel System for one-axle trailers, or the same choices for brake systems on two-axle trailers that are available for the four-wheeled motor vehicle).Checkboxes for using simple suspension data. If checked, the link underneath is set to workSuspension: Solid Axle System, and the link forseparate compliance dataRatio of the spring loaded shared b the other axle of the tandem suspension keyword =Coefficient to determine tandem suspension load transfer due to wheel spin torque (keyword = CFZ_MY_TAND). This is the load transferred to the lead axle of the tandem, divided by the total spin torque of all four wheels of the tandem. A positive sign implies that the front axle load decreases during braking (brake torque is a negative moment). This field does not exist on the Vehicle: Trailer with 1 Axle screen.Fraction of tandem static load carried by the springs of the rear axle of the tandem in the nominal load condition (keyword = R_TAND_TRAIL_STATIC). Typically this is 0.5. This field does not exist on the Vehicle: Trailer with 1 Axle screen.The Vehicle: Loaded Condition ScreenFigure 4 shows the Vehicle: Loaded Condition screen to add loads, sensors, and miscellaneous model extensions to a vehicle. You can also add a one- or two-axle trailer that is hitched to the motor vehicle.If a trailer is used, it can also carry up to four loads, and can be equipped with the same kinds of sensors as the towing vehicle (Figure 5).of vehicle that were described in the previous sections.123491022233Figure 4: Vehicle: Loaded Conditionscreen when there is no trailer.Link to a Vehicle: Assembly dataset. The vehicle type shown here (in the figure it isInd_SA ) is used to determine which of several VS solver programs should be used to make the simulation run. When thedataset hasan associated image, that image will beLinks to either or Payload: Custom datasets. These links also appearLinks to miscellaneousdatasets that add various kinds of sensor, model extensions, or other data that is intended to be grouped with the vehicle description.Trailer checkbox. When checked (Figure 5), additional links appear to specifying the trailerSeparate trailer image checkbox. When this box is checked, the image for the lead vehicle is reduced in size and a second image is shown for the linked trailer dataset. In this case, the 3x1 image style checkbox is not shown.If the Separate trailer image checkbox is not checked, then a single image is used and the 3x1 image style checkbox remains visible. Link to either a Vehicle: Trailer with 1 Axle or Vehicle: Trailer with 2 Axles dataset.1 234102 2 23 310562222333Figure 5: Vehicle: Loaded Condition screen when there is a trailer.Sprung Mass Parameter DefinitionsThree screens are used for specifying the main size and weight properties of a motor vehicle or towed trailer. In all cases, the properties of the vehicle are defined for the unladen configuration, which is sometime called the design condition or the curb condition.The data on these screen serve three main purposes:1. They define some of the main mass and inertia properties of the vehicle.2. The properties on these screens affect the interpretation of data from other screens thatdepend on load.3. The sprung mass coordinate system is used to defines the locations of other points in thevehicle model.Suspension Kinematics, Zero Jounce, and Wheel Center Heights Suspension motions are tied to vertical movement called jounce that provides the reference for many forms of nonlinear suspension kinematical data. These include lateral movement,longitudinal movement, camber angle, and toe angle.In particular, the definition of zero jounce is critical for properly using this data.The CarSim and VehSim math models support two definitions of jounce in the design load condition. One is based on the loads carried by the front and rear suspensions, so when a change is made to this screen, the definition of jounce is affected.Figure 8 shows the location of the wheel centers when the front and rear springs are in equilibrium supporting the sprung mass in a level condition, where roll and pitch angles are by definition zero. The heights of the wheel centers in a specific run will depend on the road or ground geometry, the tire sizes and properties, and the presence of additional loads. However, this screen contains all of the information needed to define the concepts of zero pitch and roll and suspension jounce.Coordinate SystemLoads, sensors, and various reference points are specified using X, Y, and Z coordinates in a coordinate system fixed in the sprung mass. The axis directions and the location of the origin of the coordinate system are defined specifically for the vehicle in the position shown on this screen. AerodynamicsThree forces and three moments define the aerodynamic effects on the sprung mass. The forces act on a point on the sprung mass called the aerodynamic reference point, defined by X, Y, and Z coordinates in the sprung mass coordinate system (see Aerodynamics). If changes are made to the wheelbase, the location of the aerodynamic reference point might need modification. Frame TwistSome vehicles have low chassis torsional stiffness as compared to suspension roll stiffness. Chassis twist influences relative roll at each axle and the distribution of load transfer between axles. The chassis twists in response to suspension forces, powertrain torque, and the roll moment at a trailer hitch if one exists.Six parameters are used in the description of chassis twist: the measured stiffness and damping about a longitudinal axis, the longitudinal position of a node point which describes the distribution of torsional stiffness along the length of the frame, two dimensions for the locations of points at which measurements were made, and a coordinate for the location at which the powertrain torque is reacted at the chassis. For independent drive axles the powertrain torque has no effect.The points used to measure chassis stiffness must be laterally equidistant front and rear, and longitudinally equidistant left and right to describe a rectangle as shown in Figure 6. If it is not possible to attach equipment to the chassis in this configuration, fixtures may be attached to provide the proper spacing. The reported stiffness in the dataset should be based on the angles of deflection and moments as applied at these points. A damping value is required for numerical stability, but its actual value has little effect on most handling maneuvers.The X coordinate of the node point can be detected by the vertical loads measured at four measurement points for the tilted chassis. For example, when the chassis is tilted to the left (it causes the load transfer from right to left) as shown in Figure 7, the load transfer measured on the two front measurement points is ∆F f, and the load transfer measured on the two rear measurement points is ∆F r. The X coordinate of the node is:X node = L • ∆F r / (∆F f + ∆F r)Where L is the distance between the front and rear measurement points.Figure 6. Rectangular geometry associated with frame twist.The effective mounting location of the engine can similarly be determined by locking the drive shaft to the transmission (as putting an automatic transmission in “park”) and applying a moment. Then, you can measure the load transfer and apply the above equation.lfFigure 7. Front and rear load transfer due to frame twist.The Vehicle: Sprung Mass screenFigure 8 shows the Vehicle: Sprung Mass screen with the controls described below.Animator reference height (keyword = Z_LENGTH). The animator resizes the shapeAnimator reference width (keyword = Y_LENGTH). The animator resizes the shape information to match vehicle dimensions. This dimension is used to stretch or shrink the width of the shape used for the vehicle sprung mass.Figure 8: Vehicle: Sprung Mass screen.Heights of the wheel spin axes above the sprung mass origin at the design load condition with zero pitch and roll (database keywords = *HWC_LF, *HWC_RF, *HWC_LR, *HWC_RR;solver keyword = H_WC([IUNIT,] IAXLE, ISIDE)). These define the relationship between the locations of the wheels relative to the sprung mass and the jounce used to define nonlinear suspension kinematical effects. They also determine how the sprung mass is located relative to the wheels in the animator. Values specified on this screen override those that appear on the suspension screens, where they appear for backward compatibility withdatasets from earlier versions of the software. If wheel center heights are not specified here, values from the suspension screen are used.Distance from the front axle to the (unladen) mass center (Keyword = LX_CG_SU[(IUNIT)]). This parameter and the wheelbase determine how much of the mass is supported by the front and rear suspensions in the design condition.Lateral coordinate of mass center (keyword = Y_CG_SU[(IUNIT)]). Although normallyzero, this can be given a non-zero value if the vehicle is not laterally symmetric. A positive value means the mass center is located on the left side of the vehicle.Height of (unladen) mass center above the origin (keyword = H_CG_SU[(IUNIT)]).Lateral coordinate of hitch center (keyword = Y_H).Normally zero, this can be given a non-zero value to study asymmetric vehicles. A positive value means the hitch point is located on the left side of the vehicle. This parameter is used only if a trailer is hooked to the vehicle in the simulated run.Hitch height above the sprung mass origin (keyword = H_H). This parameter is used only if a trailer is hooked to the vehicle in the simulated run.Wheelbase, defined as the distance between the centers of the front and rear wheels whenthe vehicle is in the design load condition (keyword = LX_AXLE ([IUNIT,] IAXLE)]).This value is also passed to the animator (keyword = X_LENGTH) to size the sprung mass shape longitudinally.Distance from the front axle to the hitch (keyword = LX_H).The point of interest is thehitch pitch pivot. This parameter is used only if a trailer is hooked to the vehicle in the simulated run.Sprung mass (keyword = M_SU [(IUNIT)]). This is the mass of the vehicle in the design load configuration excluding the unsprung masses associated with the wheels, axles, and moving suspension parts.Moments and products of inertia of the unladen sprung mass. The moments and product are all taken about the mass center of the sprung mass and are based on a vehicle axis system in which the X axis (longitudinal) and Y axis (lateral) are parallel with the ground when the vehicle is at rest on a flat level surface, and the Z axis (vertical) points up in parallel with the gravity vector.The moments of inertia in roll (IXX_SU[(IUNIT)]), pitch (IYY_SU[(IUNIT)]), and yaw (IZZ_SU[(IUNIT)])The product of inertias, also about the mass center of the sprung mass, are defined as the negative of the volume integral. For example, the definition for the XZ product is:I xz = –∫V r x z dvThe product is positive when the principal X axis of the sprung mass tilts down (looking forward). This value must be entered directly—there are no built-in tools to calculate it.Edit Radii of Gyrationwith X, Y, and Z radii of gyration as an alternative to entering moments of inertia. them are updated to reflect changes to the radii of gyration or mass. When it is unchecked, the moment of inertia fields are enabled for editing and the radii of gyration fields are locked, displaying values calculated from the mass and inertias.Radii of gyration (not parameters). Sometimes measured values for Ixx, Iyy, and Izz arenot available but Rx, Ry, and Rz can be estimated. When the Edit Radii of Gyration checkbox is checked, the corresponding moments of inertia are calculated with the equation:I = M•R2Use any of these three radii if the corresponding moment of inertia is not available but the corresponding radius can be estimated. If used:1. a guess for R x might be a third of the vehicle width,2. a guess for R y might be half the wheelbase, and3. a guess for R z might be half the wheelbase.Checkbox to reveal the list of frame twist parameters. To use frame twist, check this box and include your parameters. The flexibility parameters are shown in Figure 9.151617181920Figure 9: Frame torsional flexibility parameters.Distances between points on the chassis where the stiffness is measured (keywords = L_FRAME[(IUNIT)], W_FRAME[(IUNIT)]).Distance that the torsional node point lies behind the origin of the coordinate system, in mm.(keyword = X_NODE[(IUNIT)])Distance that the effective engine mounting point lies behind the origin of the coordinate system, in mm (keyword = X_ENG). This point should reflect the location at which a longitudinally-oriented engine reacts drive torque on the sprung mass.Torsional stiffness of the chassis about the longitudinal axis, in N-m/deg.Torsional damping of the chassis about the longitudinal axis, in N-m/deg/sec.The Vehicle: Sprung Mass (from Whole Vehicle) Screen Figure 10 shows the Vehicle: Sprung Mass (From Whole Vehicle) screen to define the size and weight properties of the motor vehicle sprung mass, based on measured properties of the whole vehicle. This screen provides an alternative to the Vehicle: Sprung Mass screen for defining themain size and weight properties of a vehicle in the unladen condition.Animator reference height (keyword = Z_LENGTH). The animator resizes the shape information to match vehicle dimensions. This dimension is used to stretch or shrink thevertical scale of the shape used for the vehicle sprung mass.12345678910311121314151617Figure 10: Vehicle: Sprung Mass (From Whole Vehicle) screen.Animator reference width (keyword = Y_LENGTH). The animator resizes the shape information to match vehicle dimensions. This dimension is used to stretch or shrink the horizontal scale of the shape used for the vehicle sprung mass.Height of the front wheel spin axes above the sprung mass origin at the design loadcondition with zero pitch and roll (database keywords = *HWC_LF, *HWC_RF, *HWC_LR, *HWC_RR; solver keyword = H_WC([IUNIT,] IAXLE, ISIDE)). This defines the relationship between the location of the wheel relative to the sprung mass and the jounce used to define toe and camber effects. It also determines how the sprung mass is located relative to the wheels in the animator. Values specified on this screen override those that appear on the suspension screens, where they appear for backward compatibility with datasets from earlier versions of the software. If wheel center heights are not specified here, values from the suspension screen are used.Wheelbase, defined as the distance between the centers of the front and rear wheels (keyword = LX_AXLE([IUNIT,] IAXLE)). This value is also passed to the animator (keyword = X_LENGTH) to size the sprung mass shape longitudinally.Distance from the front axle to the optional hitch (keyword = LX_H). The point of interest is the hitch pitch pivot. This parameter is used only if a trailer is hooked to the vehicle in the simulated run.Lateral coordinate of hitch center (keyword = Y_H). Normally zero, this can be given a non-zero value to study asymmetric vehicles. A positive value means the hitch point is located on the left side of the vehicle. This parameter is used only if a trailer is hooked to the vehicle in the simulated run.Hitch height above the sprung mass origin (keyword = H_H). This parameter is used only ifa trailer is hooked to the vehicle in the simulated run.Measured weight under each tire (database keywords = *W_LF, *W_RF, *W_LR, *W_RR). These are used to calculate the lateral and longitudinal positions of the mass center of the total vehicle as measured, and its total mass.Unsprung mass of the front and rear suspensions on the measured vehicle (databasekeywords = *M_US(1), *M_US(2)). These masses are removed from the total vehicle to obtain the sprung mass, and to calculate the location of the mass center of the sprung mass and its inertia properties. Unsprung mass values entered here are not used by the solver program. The solver obtains unsprung mass information from the suspension screens, to facilitate definition of a vehicle with suspensions different from those installed on the measured vehicle.Spin inertias of the front and rear suspensions on the measured vehicle (database keywords = *IW(1), *IW(2)). These inertias are removed from the total vehicle to obtain the sprung mass pitch inertia. Inertia values entered here are not used by the solver program. The solver obtains unsprung mass inertia information from the suspension screens, to facilitate definition of a vehicle with suspensions different from those installed on the measured vehicle.Track width of the front and rear suspensions on the measured vehicle (database keywords = *L_TRACK(1), *L_TRACK(2)). These dimensions are used to calculate the location of the mass center of the sprung mass and its inertia properties. Dimensions entered here are not used by the solver program. The solver obtains track information from the suspensionscreens, to facilitate definition of a vehicle with suspensions different from those installed on the measured vehicle.Distance the mass centers of the complete vehicle as measured and of the sprung mass lie behind the front axle. These are not entered by the user, but are calculated from other information on the screen. Their values are updated automatically when values involved in the calculations are changed. The value for the sprung mass is passed to the solver program (LX_CG_SU[(IUNIT)]). The value for the measured vehicle is provided for reference.Lateral coordinates of the mass centers of the complete vehicle as measured and of the sprung mass. A positive value means the point is located on the left side of the vehicle. These are not entered by the user, but are calculated from other information on the screen. Their values are updated automatically when values involved in the calculations are changed. The value for the sprung mass is passed to the solver program (keyword = Y_CG_SU[(IUNIT)]). The value for the measured vehicle is provided for reference.Height of the mass centers of the complete vehicle as measured and of the sprung mass above the vehicle origin. The dimension for the complete vehicle as measured (database keyword = *H_CG_TU) is used to calculate other values on this screen. The dimension for the sprung mass represents the vehicle in its design position and is passed to the solver program (keyword = H_CG_SU [(IUNIT)]).Selecting the checkbox reveals a field for the yaw and roll inertia of the unsprung mass of aaxle plus wheels and tire (the entire unsprung mass) about the mass center along the roll axis. The same number is also used internally for the yaw moment of inertia. These inertias are removed from the total vehicle to obtain the sprung mass inertia properties. Inertia values entered here are not used by the solver program. The solver obtains unsprung mass inertia information from the suspension screens, to facilitate definition of a vehicle with suspensions different from those installed on the measured vehicle.1518Total calculated mass of the measured vehicle and its sprung mass. The sprung mass is themass of the vehicle in the design load configuration minus the unsprung masses associated with the wheels, axles, and moving suspension parts. The sprung mass is passed to the solver (keyword = M_SU[(IUNIT)]). The mass of the total vehicle is provided for reference.Moments and products of inertia of the total vehicle as measured, and calculated values for the sprung mass. The moments and product are all taken about the respective mass centers of the measured vehicle or the sprung mass and are based on a vehicle axis system in which the X axis (longitudinal) and Y axis (lateral) are parallel with the ground when the vehicle is at rest on a flat level surface, and the Z axis (vertical) points up in parallel with the gravity vector.。
carsim参数建模步骤
Carsim参数建模步骤如下:
1. 数据准备:收集与车辆动力学性能相关的数据,如车辆重心高度、车轮半径、转向挠度等。
2. 建立基本模型:使用Carsim提供的车辆建模工具创建基本
的车辆模型,包括车辆的物理结构、悬挂系统、动力系统等。
3. 参数设置:根据实际车辆参数,对模型进行参数设置,包括车辆质量、悬挂刚度、阻尼系数、轮胎摩擦系数等。
4. 精细调整:根据实际车辆的动力学性能和试验数据,对模型进行进一步的调整和优化,以使模型更加准确地反映实际情况。
5. 验证模型:通过与实际道路试验数据进行比对,验证模型的准确性和可靠性。
6. 仿真分析:使用Carsim进行各种驾驶仿真分析,如刹车性能、转向性能、悬挂系统的动态响应等,以评估车辆的动力学性能。
7. 结果分析:根据仿真结果进行数据分析和解释,为车辆设计和性能优化提供参考。
8. 参数调整:根据仿真分析结果,对模型的参数进行进一步调整,以实现更好的性能。
9. 迭代优化:根据需求,反复进行模型参数调整和仿真分析,逐步优化车辆的动力学性能,直到达到预期的效果。
10. 结果报告:整理和总结仿真分析结果,撰写报告并进行评估,提供给相关人员参考,并作为改进车辆设计的依据。
SuspensionSim软件简单教程及主销(转向轴线)的建模讲解请将硬体安全密钥插入相应的接口执行程序双击SuspensionSim图标开始运行程序。
首先出现的是版权所有的通告,然后便会出现以下窗口。
1、选择一个已有的模板或者悬架模型●点击File(文件)图标●点击Open(打开)图标●模型文件夹的位置因安装过程和设置不同而异,点击Tool Box(工具箱)-Suspen ClassSept05。
●若没有出现模型文件夹,则需要双击SusSim Models(悬架仿真模型)。
●最后,双击悬架模型,Strut Front Suspension 1。
模型的名称会出现在标题栏上。
关闭此窗口。
2、生成模型的几何图形●选择Graphics(绘图)图标如上图所示●选定模型的图像会出现在屏幕上●在该窗口中,还可以动画回放模型的求解结果。
模型可以通过鼠标来改变位置姿态。
3、关闭模型的几何图形窗口并回到主界面(点击右上角X图标)4、生成解算程序●选择生成解算程序图标,或者计算器图标。
对悬架模型做过任何改动之后都要重新生成结算程序。
●下面窗口将被显示此教程中我们选择平顺性实验:●用户可以制定车轮的跳动量和轮心初始点位置●用户可以指定仿真的步数●在选择平顺性试验之后,点击Solve。
一旦开始解算,轮心的位置会实时更新显示●点击OK,回到初始界面✧SuspensionSim Demo会出现并提示当前剩余的解算步数。
5、仿真结果绘图选择Plot SDF(绘制仿真数据图)的图标如上图所示,会在左侧出现一个绘图菜单,通过该菜单可以让用户绘制悬架两个特征参数之间的关系图。
用户可以滚动鼠标选择表单中的参数作为X轴数据,而Y的数据是车轮跳动量。
同时你还需要选择是左轮、右轮还是平均数据。
还可以根据需要选择是否绘制栅格。
●用户需要花几分钟的时间来熟悉绘图菜单。
高亮显示参数然后双击SDF图标来更新绘图●点击Format图标来熟悉如何修改图标标题坐标轴注释字体大小和字形等功能。
一车体空载情况下的车体信息(1)簧上质量的质心距前轴的距离mm (2)簧上质量质心距地面的高度mm (3)轴距mm(4)质心的横向偏移量mm(5)簧载质量kg(6)对x轴的极惯性矩(lxx)kg-m2 (7)对y轴的极惯性矩(lyy)kg-m2 (8)对z轴的极惯性矩(lzz)kg-m2 (9)对x、y轴的惯性积(lxy)kg-m2 (10)对x、z轴的惯性积(lxz)kg-m2 (11)对y、z轴的惯性积(lyz)kg-m2二空气动力学(1)空气动力学参考点X mm(2)空气动力学参考点Y mm(3)空气动力学参考点Z mm(4)迎风面积 m2(5)空气动力学参考长度 mm(6)空气密度 kg/m3(7)C Fx(空气动力学系数)与slip angle (行车速度方向与空气流动方向的夹角)的关系(8)C Fy与slip angle的关系(9)C Fz与slip angle的关系(10)CMx与slip angle的关系(11)CMy与slip angle的关系(12)CMz与slip angle的关系三传动系1 最简单的一种(1)后轮驱动所占的比值,为1时,后轮驱动;为0时,前轮驱动(2)发动机的功率KW2 前轮驱动或后轮驱动1)发动机特性(1)各个节气门位置下,发动机扭矩(N-m)与发动机转速(rpm)的关系(2)打开节气门的时间迟滞sec(3)关闭节气门的时间迟滞sec(4)曲轴的旋转惯量kg-m2(5)怠速时发动机的转速rpm2)离合器特性a 液力变矩器(1)扭矩比(输出比输入)与速度比(输出比输入)的关系(2)液力变矩器的参数1/K与速度比(输出比输入)的关系(3)输入轴的转动惯量kg-m2(4)输出轴的转动惯量kg-m2b 机械式离合器(1)输出的最大扭矩(N-m)与离合器接合程度(0代表完全结合,1代表完全分离)的关系(2)接合时间迟滞sec(3)分离时间迟滞sec(4)输入轴的转动惯量kg-m2(5)输出轴的转动惯量kg-m23)变速器(1)正向挡位和倒挡的传动比,转动惯量(kg-m2),正向传动与反向传动效率(2)中间挡的转动惯量(kg-m2)(3)换挡时间sec(4)各个挡位中低速齿轮的输出转速(rpm)与节气门开口位置的关系4)差速器(1)左右车轮扭矩差(N-m)与车轮速度差(rpm)的关系(2)抗扭刚度N-m/deg(3)抗扭阻尼N-m-s/deg(4)传动比(5)正反向的传动效率(6)驱动轴的惯性量kg-m2(7)半轴到左侧车轮的惯性量kg-m2(8)半轴到右侧车轮的惯性量kg-m2还包括传动系(不包括发动机)的自然频率(Hz)与阻尼率3 四轮驱动与前轮驱动相比,增加分动箱,其中包括:(1)前后轴的扭矩差(N-m)与前后轮的转速差(rpm)的关系(2)分配到后轮上的扭矩(百分比形式)(3)传动比(4)扭杆刚度N-m/deg(5)扭杆阻尼N-m-s/deg还包括传动系的正效率与逆效率四制动系统1 简单制动系统(1)制动力矩(N-m)与车轮汽缸压力(MPa)的关系,分左前轮,右前轮,左后轮,右后轮,为一比例常数或一条变化曲线(2)比例阀之后的管路压力(MPa)与其输入压力(MPa)的关系,分左前轮,右前轮,左后轮,右后轮,通常为一比例常数(3)流体动力学时间常数,包括左前,右前,左后,右后,单位为sec (4)流体迟滞,包括左前,右前,左后,右后,单位为sec(5)前后车轮ABS工作的滑移率区间(6)ABS工作截止的最低速度km/h(7)经ABS控制后输出的压力MPa2 考虑助力与热衰退的制动系统(1)比例阀输出压力(Mpa)与比例阀输入压力(Mpa)的关系,包括左前,左后,右前,右后(2)制动盘质量kg(3)在0摄氏度时制动盘的比热kJ/kg/C(4)单位温度升高比热的变化量kJ/kg/C2(5)制动钳压力(MPa)与制动钳体积(mm3)的关系(6)制动钳气缸中单位流量所产生的压力MPa/(mm3/s)(7)冷却系数(1/s)与车辆速度(km/h)的关系(8)不同制动盘温度(C)下,制动力矩(N-m)与制动轮缸压力(Mpa)的关系(9)控制策略(A型为调节主缸后的压力值;B型为调节比例阀后的管路压力;也可不控制)(10)四个车轮的制动盘初始温度(C)(11)空气温度(C)(12)助力后输出的力(N)与助力前输入的力(N)的关系,助力后输出的力为主缸压力(13)踏板的杠杆比(14)主缸直径mm(15)启动助力的时间迟滞sec(16)关闭助力的时间迟滞sec五转向系统1) 转向柱管系统:(1)转向柱管的惯性kg-m2(2)转向系统的惯量kg-m2(3)转向柱管阻尼Nm-s/deg(4)转向柱管干摩擦N-m(5)转向盘自由角行程deg2) 主销的几何特性:(1)汽车前进方向投影,主销轴线与半轴轴线的交点距车轮中心的距离mm,包括四个车轮(2)主销内倾角deg(3)主销后倾角deg(4)水平路面行驶,汽车侧面投影中,车轮质心所驶过的直线与主销轴线的交点距车轮中心的距离mm3)前轮转向方式包括非助力齿条齿轮式和循环球式,助力齿条齿轮式和循环球式助力齿条齿轮式(1)齿条的行程(mm)与齿轮转角(deg)的关系(2)左右转向轮转角(deg)与齿条的行程(mm)的关系(3)因转向系统柔性所引起的转向角(deg)随主销力矩(N-m)的关系,主销力矩为左右主销力矩之和。